. 2013 Dec 16;8(12):e83862.
doi: 10.1371/journal.pone.0083862. eCollection 2013.

C-terminal domain of ICA69 interacts with PICK1 and acts on trafficking of PICK1-PKCα complex and cerebellar plasticity

Affiliations

C-terminal domain of ICA69 interacts with PICK1 and acts on trafficking of PICK1-PKCα complex and cerebellar plasticity

Zhen Wang et al. PLoS One. .

Abstract

Background: PICK1 (protein interacting with C-kinase 1) is a PKC (protein kinase C)-binding protein, which is essential for synaptic plasticity. The trafficking of PKCα-PICK1 complex to plasma membrane is critical for the internalization of GluR2 and induction of long-term depression. ICA69 (islet cell autoantigen 69 kDa) is identified as a major binding partner of PICK1. While heteromeric BAR domain complex is suggested to underlie the interaction between PICK1 and ICA69, the role of C-terminal domain of ICA69 (ICAC) in PICK1-ICA69 complex is unknown.

Methodology/principal findings: We found that ICAC interacted with PICK1 and regulated the trafficking of PICK1-PKCα complex. ICAC and ΔICAC (containing BAR domain) might function distinctly in the association of ICA69 with PICK1. While ΔICAC domain inclined to form clusters, the distribution of ICAC was diffuse. The trafficking of PICK1 to plasma membrane mediated by activated PKCα was inhibited by ICA69. This action might ascribe to ICAC, because overexpression of ICAC, but not ΔICAC, interrupted PKCα-mediated PICK1 trafficking. Notably, infusion of maltose binding protein (MBP) fusion protein, MBP-ICA69 or MBP-ICAC, in cerebellar Purkinje cells significantly inhibited the induction of long-term depression at parallel fiber- and climbing fiber-Purkinje cell synapses.

Conclusions: Our experiments showed that ICAC is an important domain for the ICA69-PICK1 interaction and plays essential roles in PICK1-mediated neuronal plasticity.


Conflict of interest statement

Competing Interests: The authors have declared that no competing interests exist.

Figures

Figure 1
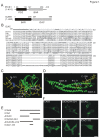
Figure 1. Sequence analysis of ICAC and expression of ICA69 truncations in HEK293T cells.
(A) An illustration of domains of rat PICK1 (upper panel) and ICA69 (lower panel). The numbers indicate the locations of amino acids in PICK1 and ICA69. (B) Alignments of ICAC homologues in Homo sapiens (NP-071682; Homo), Pan troglodytes (XP-518971.2; Pan), Canis familiaris (XP-850551.1; Canis), rat (Q63054.2; Rat), Mus musculus (NP-034622.3; Mouse), and Xenopus laevisgi (NP-001084630.1; Xenopus). Above the sequences, stars, colons, and periods indicate that amino acid positions are identical, highly conserved, or weakly conserved. Shadows are distinct residues. (C) A predicted tertiary structural model of interaction between ICAC and PICK1-PDZ (green). ICAC131-158 fragment (yellow: carbon backbone; blue: secondary structure) was predicted to interact with PICK1-PDZ. (D) A predicted tertiary structural model of interaction between ICAC and BAR (green). ICAC 131-158 fragment (yellow: carbon backbone; blue: secondary structure) was predicted to interact with BAR. (E) Schematic diagrams show a series of ICA69 truncation mutants designed, as labeled on left. The numbers indicate the positions of amino acids in ICA69. ΔICAC: 1-256, ICAC: 257-480. (F) Expressions of GFP-tagged ICA69 and its mutants in 293T cells. The upper row shows three different cells expressing ICA69, ΔICAC84-224, or ΔICAC, as labeled. The lower row shows three different cells expressing ICAC1-83, ICAC84-224, or ICAC, as labeled. Scale bar: 10 µm. Data in (F) are representative of more than 4 experiments.
Figure 2
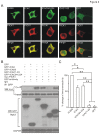
Figure 2. ICAC associates with PICK1 in vitro.
(A) 293T cells were co-transfected with myc-PICK1 (red) and GFP-tagged ICA69 or its truncations (green). Note that the expression pattern of PICK1 in cytosol was highly consistent with that of ICA69, ICAC or ICAC84-224. In contrast, expression patterns of ICAC1-83 and PICK1 were quite distinct, as well as GFP. Scale bar: 10 µm. (B) Myc-PICK1 and GFP-tagged ICA69 or its truncations were co-expressed in 293T cells. Constructs transfected in experiments are listed above as “+” or “-”. Cell lysates were immunoprecipitated with anti-GFP antibody. Total expressions of PICK1, ICA69, ICAC, and other truncations are shown in Input lanes as probed by anti-myc or anti-GFP antibody. The arrow on right shows GFP-ICAC84-224 blot. Note that PICK1 was only pulled down by ICA69, ICAC and ICAC84-224, but not ICAC1-83. In negative controls, PICK1 was not pulled down by IgG or GFP. GAPDH was the internal control. (C) Y axis represents the percentage of each precipitated protein normalized to ICA69 group. Percentages were 60±7% (ICAC), 66±5% (ICAC84-224), 11±5% (ICAC1-83), and 6±3% (GFP), which were derived from 4 independent cultures. *P <0.05. **P <0.01.
Figure 3
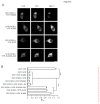
Figure 3. FRET detection of the association of ICAC and PICK1.
(A) Fluorescence microscopic images of HEK293T cells expressing fusion proteins indicated on left. Images were made using CFP filter (left column), YFP filter (middle column), or FRET filter (right column). Scale bar: 10 µm. (B) Summary of N FRET of different groups. The value of NFRET was proportional to FRET efficiency. When FRET occurs, N FRET was greater than 0.2. The values of N FRET were 1.28±0.05 (CFP-YFP, n = 66), 0.11±0.01 (CFP+YFP, n = 72), 1.06±0.04 (CFP-PICK1+YFP-ICA69, n = 68), 0.08±0.01 (CFP-PICK1+YFP, n = 54), 0.08±0.01 (CFP-PICK1+YFP-PSD95, n = 57), 0.13±0.02 (CFP-PICK1+YFP-ICAC1-83, n = 56), 0.86±0.02 (CFP-PICK1+YFP-ICAC84-224, n = 68), 0.89±0.03 (CFP-PICK1+YFP-ICAC, n = 66), and 0.11±0.01 (CFP+YFP-PICK1, n = 51). Data were derived from 3 independent experiments. **P <0.01.
Figure 4
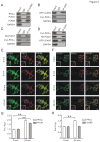
Figure 4. TPA induces the trafficking of GFP-PICK1 to plasma membrane following mCherry-PKCα, with no effect when GFP-ICA69 and mCherry-PKCα were co-expressed.
(A) Co-IP was performed with rabbit anti-ICA69 antibody in rat brain homogenate. The antibody pulled down ICA69 itself, and a significant amount of PICK1 and PKCα, indicating that ICA69, PICK1, and PKCα formed complex in vivo. Rabbit anti- PKCα, mouse anti-PICK1, and rabbit anti-ICA69 antibodies were used for Western blot. Rabbit IgG was the negative control. (B) GFP-ICA69 and myc-PKCα plasmids were co-transfected to 293T cells. GFP-ICA69 was immunoprecipitated using rabbit anti-GFP antibody, indicating that PKCα is not pulled down by ICA69. Rabbit anti-GFP and mouse anti-myc antibodies were used for Western blot. Rabbit IgG was negative control. (C) HA-PICK1 and myc-PKCα plasmids were co-transfected to 293T cells. HA-PICK1 was immunoprecipitated using mouse anti-HA antibody, indicating that PKCα is pulled down by PICK1. Rabbit anti-PICK1 and mouse anti-myc antibodies were used for Western blot. Mouse IgG was negative control. (D) myc-PKCα, HA-PICK1, and GFP-ICA69 were triple-transfected to 293T cells. Both myc-PKCα and HA-PICK1 were immunoprecipitated using rabbit anti-GFP antibody. Mouse anti-PICK1 and anti-myc antibodies were used for Western blot. Mouse IgG was negative control. (E) Activation of mCherry-PKCα by 2 μM TPA induced an increased translocation of GFP-PICK1 and mCherry-PKCα within 24 min to plasma membrane. White arrowheads show typical locations where PICK1 and PKCα were transported to plasma membrane. For images at 0 and 24 min, higher magnifications of plasma membrane (enclosed in small white boxes) were presented to show the translocation of PICK1 and PKCα. (F) GFP-ICA69 did not translocate with mCherry-PKCα when co-expressed in 293T cells after TPA was administrated. Activation of mCherry-PKCα by 2 μM TPA induced a translocation mCherry-PKCα within 24 minutes from cytoplasm to membrane. White arrowheads show the typical locations where PKCα was transported to plasma membrane but ICA69 was retained. For images at 0 and 24 min, higher magnifications of membrane (enclosed in small white boxes) were presented to show the translocation of PKCα but not ICA69. (G) mCherry-PKCα and GFP-PICK1 were co-expressed in 293T cells. Fm/Fcyt values of mCherry-PKCα were 0.97±0.02 (0 min; n = 81) and 1.91±0.06 (24 min; n = 78). Fm/Fcyt values of GFP-PICK1 were 0.98±0.01 (0 min; n = 81) and 1.68±0.04 (24 min; n = 78). (H) mCherry-PKCα and GFP-ICA69 were co-expressed in 293T cells. Fm/Fcyt values of mCherry-PKCα were 1.01±0.01 (0 min; n = 89) and 1.50±0.03 (24 min; n = 80). Fm/Fcyt values of GFP-ICA69 were 1.00±0.01 (0 min; n = 89) and 1.03±0.02 (24 min; n = 80). Scale bars: 10 µm. Data were derived from at least 4 independent cultures. **P <0.01.
Figure 5
Figure 5. Both ICA69 and ICAC abolish TPA-induced translocation of PICK1.
(A) GFP-ICA69, mCherry-PKCα, and CFP-PICK1 were co-expressed in 293T cells. Co-transfection of ICA69 abolished 2 μM TPA-induced translocation of PICK1 but not PKCα. Note that cytosolic clusters of ICA69 and PICK1 were increased in some cells as time elapsed. White arrowheads show typical locations where PKCα was transported to plasma membrane, while ICA69 and PICK1 were retained. For images at 0 and 24 min, higher magnifications of plasma membrane (enclosed in small white boxes) were presented to show the translocation of PKCα, but not ICA69 or PICK1. (B) At 0 min, Fm/Fcyt values of GFP-ICA69, mCherry-PKCα, and CFP-PICK1 were 0.97±0.02, 1.00±0.02, and 0.99±0.02, respectively (n = 84). At 24 min, Fm/Fcyt values of GFP-ICA69, mCherry-PKCα, and CFP-PICK1 were 0.96±0.02, 1.74±0.04, and 0.96±0.02, respectively (n = 82). (C) GFP-ICAC, mCherry-PKCα, and CFP-PICK1 were co-transfected to 293T cells. Co-transfection of ICAC abolished 2 μM TPA-induced translocation of PICK1 but not PKCα. White arrowheads show typical locations where PKCα was transported, while ICAC and PICK1 were retained. For images at 0 and 24 min, higher magnifications of plasma membrane (enclosed in small white boxes) were presented to show the translocation of PKCα but not ICAC or PICK1. (D) At 0 min, Fm/Fcyt values of GFP-ICAC, mCherry-PKCα, and CFP-PICK1 were 0.95±0.02, 1.03±0.02, and 0.98±0.02, respectively (n = 89). At 24 min, Fm/Fcyt values of GFP-ICAC, mCherry-PKCα, and CFP-PICK1 were 0.95±0.01, 1.73±0.04, and 0.97±0.01, respectively (n = 89). Scale bar: 10 µm. Data were derived from at least 4 independent cultures. **P <0.01.
Figure 6
Figure 6. Different roles of ICAC84-224 and ΔICAC in TPA-induced PICK1 translocation.
(A) GFP-ICAC84-224, mCherry-PKCα, and CFP-PICK1 were co-expressed in 293T cells. 2 μM TPA induced the translocation of PKCα to the membrane from 6 min to 24 min. Both ICAC84-224 and PICK1 were retained in cytosol and they displayed similar diffuse distribution. For images at 0 and 24 min, higher magnifications of plasma membrane (enclosed in small white boxes) were presented to show the translocation of PKCα but not ICAC84-224 or PICK1. (B) At 0 min, Fm/Fcyt values of GFP-ICAC84-224, mCherry-PKCα, and CFP-PICK1 were 0.96±0.03, 0.96±0.02, and 0.96±0.02, respectively (n = 88). At 24 min, Fm/Fcyt values of GFP-ICAC84-224, mCherry-PKCα, and CFP-PICK1 were 0.95±0.01, 1.81±0.05, and 0.94±0.02, respectively (n = 80). (C) GFP-ΔICAC, mCherry-PKCα, and CFP-PICK1 were co-expressed in 293T cells. 2 μM TPA induced a translocation of them all to the membrane as time elapsed. For images at 0 and 24 min, higher magnifications of plasma membrane (enclosed in small white boxes) were presented to show the translocation of ΔICAC, PKCα, and PICK1. (D) At 0 min, Fm/Fcyt values of GFP-ΔICAC, mCherry-PKCα, and CFP-PICK1 were 0.94±0.03, 0.90±0.02, and 0.89±0.01, respectively (n = 89). At 24 min, Fm/Fcyt values of GFP-ΔICAC, mCherry-PKCα, and CFP-PICK1 were 1.85±0.06, 2.13±0.07, and 1.65±0.05, respectively (n = 80). Scale bars: 10 µm. Data were derived from at least 4 independent cultures. **P <0.01.
Figure 7
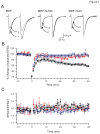
Figure 7. ICA69 and ICAC inhibit PF-LTD.
(A) Example traces before and after PF-LTD. Currents indicated by 1 (black) or 2 (grey) were collected at time points indicated in (B). (B) Comparison of three groups of neurons recorded. Mean peak amplitudes of PF-evoked EPSC1 are displayed versus time (Black: MBP, n = 10; Red: MBP-ICA69, n = 10; Blue: MBP-ICAC, n=9). Following a 10-min baseline recording, LTD was induced at t = 0 min. Tetanic stimulation is indicated by the upward arrow. (C) Time courses of PPF of EPSCs. Black: MBP, n = 10; Red: MBP-ICA69, n = 10; Blue: MBP-ICAC, n=9.
Figure 8
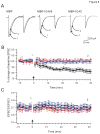
Figure 8. ICA69 and ICAC inhibit CF-LTD.
(A) Example traces before and after CF-LTD. Note that EPSC1 was bigger than EPSC2. Currents indicated by 1 (black) or 2 (grey) were collected at times indicated in (B). (B) Comparison of three groups. Mean peak amplitudes of CF-EPSC1 are displayed versus time (Black: MBP, n = 9; Red: MBP-ICA69, n = 11; Blue: MBP-ICAC, n=9). Following a 10-min baseline recording, CF-LTD was induced at t = 0 min. Tetanic stimulation is indicated by the upward arrow. (C) Time courses of PPF of EPSCs. Black: MBP, n = 9; Red: MBP-ICA69, n = 11; Blue: MBP-ICAC, n=9.

Similar articles

Cited by

References

    1. Malinow R, Malenka RC (2002) AMPA receptor trafficking and synaptic plasticity. Annu Rev Neurosci 25: 103-126. doi:10.1146/annurev.neuro.25.112701.142758. PubMed: 12052905. - DOI - PubMed
    1. Staudinger J, Zhou J, Burgess R, Elledge SJ, Olson EN (1995) PICK1: a perinuclear binding protein and substrate for protein kinase C isolated by the yeast two-hybrid system. J Cell Biol 128: 263-271. doi:10.1083/jcb.128.3.263. PubMed: 7844141. - DOI - PMC - PubMed
    1. Dev KK, Nishimune A, Henley JM, Nakanishi S (1999) The protein kinase C alpha binding protein PICK1 interacts with short but not long form alternative splice variants of AMPA receptor subunits. Neuropharmacol 38: 635-644. doi:10.1016/S0028-3908(98)00230-5. - DOI - PubMed
    1. Xia J, Zhang X, Staudinger J, Huganir RL (1999) Clustering of AMPA receptors by the synaptic PDZ domain-containing protein PICK1. Neuron 22: 179-187. doi:10.1016/S0896-6273(00)80689-3. PubMed: 10027300. - DOI - PubMed
    1. Iwakura Y, Nagano T, Kawamura M, Horikawa H, Ibaraki K et al. (2001) N-Methyl-D-aspartate-induced alpha-amino-3-hydroxy-5-methyl-4-isoxazoleproprionic acid (AMPA) receptor down-regulation involves interaction of the carboxyl terminus of GluR2/3 with Pick1. Ligand-binding studies using Sindbis vectors carrying AMPA receptor decoys. J Biol Chem 276: 40025-40032. doi:10.1074/jbc.M103125200. PubMed: 11498531. - DOI - PubMed

Publication types

MeSH terms

LinkOut - more resources