

Quantitative analysis of axonal transport by using compartmentalized and surface micropatterned culture of neurons
- PMID: 24358503
- PMCID: PMC3643179
- DOI: 10.1021/cn3000026
Quantitative analysis of axonal transport by using compartmentalized and surface micropatterned culture of neurons
Abstract
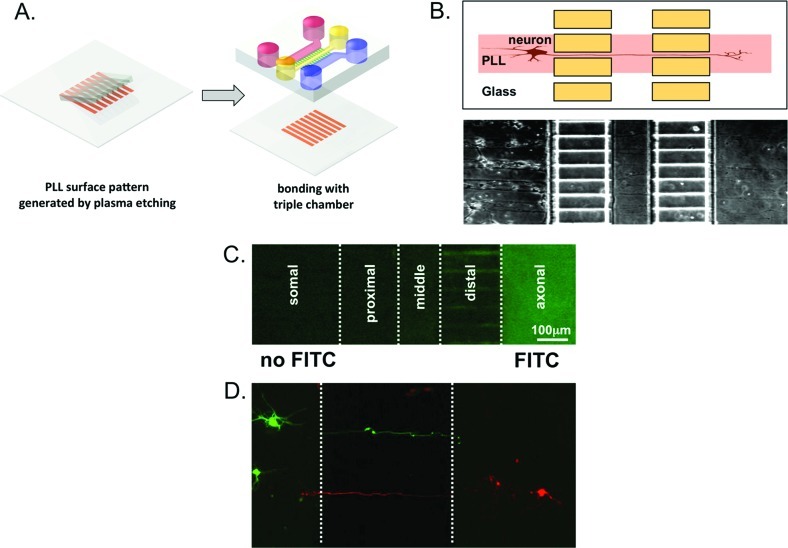
Mitochondria, synaptic vesicles, and other cytoplasmic constituents have to travel long distance along the axons from cell bodies to nerve terminals. Interruption of this axonal transport may contribute to many neurodegenerative diseases including Alzheimer's disease (AD). It has been recently shown that exposure of cultured neurons to β-amyloid (Aβ) resulted in severe impairment of mitochondrial transport. This Letter describes an integrated microfluidic platform that establishes surface patterned and compartmentalized culture of neurons for studying the effect of Aβ on mitochondria trafficking in full length of axons. We have successfully quantified the trafficking of fluorescently labeled mitochondria in distal and proximal axons using image processing. Selective treatment of Aβ in the somal or axonal compartments resulted in considerable decrease in mitochondria movement in a location dependent manner such that mitochondria trafficking slowed down more significantly proximal to the location of Aβ exposure. Furthermore, this result suggests a promising application of microfluidic technology for investigating the dysfunction of axonal transport related to neurodegenerative diseases.
Figures


Similar articles
-
Regulation of Synaptic Amyloid-β Generation through BACE1 Retrograde Transport in a Mouse Model of Alzheimer's Disease.J Neurosci. 2017 Mar 8;37(10):2639-2655. doi: 10.1523/JNEUROSCI.2851-16.2017. Epub 2017 Feb 3. J Neurosci. 2017. PMID: 28159908 Free PMC article.
-
Imaging organelle transport in primary hippocampal neurons treated with amyloid-β oligomers.Methods Cell Biol. 2016;131:425-51. doi: 10.1016/bs.mcb.2015.06.012. Epub 2015 Sep 2. Methods Cell Biol. 2016. PMID: 26794527
-
Amyloid beta-mediated KIF5A deficiency disrupts anterograde axonal mitochondrial movement.Neurobiol Dis. 2019 Jul;127:410-418. doi: 10.1016/j.nbd.2019.03.021. Epub 2019 Mar 25. Neurobiol Dis. 2019. PMID: 30923004
-
The pathophysiology of axonal transport in Alzheimer's disease.J Alzheimers Dis. 2015;43(4):1097-113. doi: 10.3233/JAD-141080. J Alzheimers Dis. 2015. PMID: 25147115 Review.
-
Mitochondrial traffic jams in Alzheimer's disease - pinpointing the roadblocks.Biochim Biophys Acta. 2016 Oct;1862(10):1909-17. doi: 10.1016/j.bbadis.2016.07.010. Epub 2016 Jul 25. Biochim Biophys Acta. 2016. PMID: 27460705 Review.
Cited by
-
Morphometric assessment of toxicant induced neuronal degeneration in full and restricted contact co-cultures of embryonic cortical rat neurons and astrocytes: using m-Dinitrobezene as a model neurotoxicant.Toxicol In Vitro. 2015 Apr;29(3):564-74. doi: 10.1016/j.tiv.2014.12.015. Epub 2014 Dec 30. Toxicol In Vitro. 2015. PMID: 25553915 Free PMC article.
-
β-Amyloid (Aβ) oligomers impair brain-derived neurotrophic factor retrograde trafficking by down-regulating ubiquitin C-terminal hydrolase, UCH-L1.J Biol Chem. 2013 Jun 7;288(23):16937-16948. doi: 10.1074/jbc.M113.463711. Epub 2013 Apr 18. J Biol Chem. 2013. PMID: 23599427 Free PMC article.
-
Three-Dimensional Models of the Human Brain Development and Diseases.Adv Healthc Mater. 2018 Jan;7(1):10.1002/adhm.201700723. doi: 10.1002/adhm.201700723. Epub 2017 Aug 28. Adv Healthc Mater. 2018. PMID: 28845922 Free PMC article. Review.
-
Morphometric and computational assessments to evaluate neuron survival and maturation within compartmentalized microfluidic devices: The influence of design variation on diffusion-driven nutrient transport.Neurosci Lett. 2019 Jun 11;703:58-67. doi: 10.1016/j.neulet.2019.03.025. Epub 2019 Mar 15. Neurosci Lett. 2019. PMID: 30885631 Free PMC article.
-
Advances in high-throughput single-cell microtechnologies.Curr Opin Biotechnol. 2014 Feb;25:114-23. doi: 10.1016/j.copbio.2013.09.005. Epub 2013 Dec 18. Curr Opin Biotechnol. 2014. PMID: 24484889 Free PMC article. Review.
References
-
- Chevalier-Larsen E.; Holzbaur E. L. (2006) Axonal transport and neurodegenerative disease. Biochim. Biophys. Acta 1762, 1094–1108. - PubMed
-
- Morfini G. A.; Burns M.; Binder L. I.; Kanaan N. M.; LaPointe N.; Bosco D. A.; Brown R. H. Jr.; Brown H.; Tiwari A.; Hayward L.; Edgar J.; Nave K. A.; Garberrn J.; Atagi Y.; Song Y.; Pigino G.; Brady S. T. (2009) Axonal transport defects in neurodegenerative diseases. J. Neurosci. 29, 12776–12786. - PMC - PubMed
