. 2014 Feb;11(2):165-74.
doi: 10.2174/1567205010666131212114156.

Low plasma leptin in cognitively impaired ADNI subjects: gender differences and diagnostic and therapeutic potential

Affiliations

Low plasma leptin in cognitively impaired ADNI subjects: gender differences and diagnostic and therapeutic potential

Jane M Johnston et al. Curr Alzheimer Res. 2014 Feb.

Abstract

Analysis of data derived from the Alzheimer's Disease Neuroimaging Initiative (ADNI) program showed plasma leptin levels in individuals with Mild Cognitive Impairment (MCI) or Alzheimer's disease (AD) to be lower than those of subjects with normal cognition (NC). Approximately 70% of both men and women with MCI have plasma leptin levels lower than the median values of NC. Additionally, half of these subjects carry at least one apolipoprotein-E4 (APOE-ε4) allele. A subgroup of participants also had cerebrospinal fluid (CSF) leptin measured. Plasma leptin typically reflected the levels of leptin in CSF in all groups (Control/MCI/AD) in both genders. The data suggest that plasma leptin deficiency provides an indication of potential CNS leptin deficiency, further supporting the exploration of plasma leptin as a diagnostic marker for MCI or AD. The important question is whether leptin deficiency plays a role in the causation of AD and/or its progression. If this is the case, individuals with early AD or MCI with low plasma leptin may benefit from leptin replacement therapy. Thus, these data indicate that trials of leptin in low leptin MCI/early-stage AD patients should be conducted to test the hypothesis.


Figures

Figure 1
Figure 1. Low Plasma Leptin Levels are Associated with MCI and AD in Men and Women
Traditional box and whisker plot of plasma Leptin. Plasma aliquots were interrogated in 2009 by Rules – Based Medicine (RBM, Austin TX) for levels of 190 analytes in 566 participants, including leptin, using the multiplex Human Discovery MAP™ panel and a Luminex 100 Platform (see Table 1 for characteristics). Dynamic range for each plasma analyte including leptin, is provided at the ADNI Website. A total of 352 subjects also had CSF AD biomarker levels provided by the ADNI Biomarker Core. NL-M: Normal men; MCI-M: MCI Men; AD-M: Men with AD; NL-F: Normal women; MCI-F: MCI Women; AD-F: Women with AD. Boxes represent the interquartile range (1st to 3rd quartiles) with the median line bolded. Whiskers are extended to 1.5 times the interquartile range and outliers are indicated with dots. When analyzed by gender, plasma leptin values in men were approximately half those of women regardless of subject faction (NC, MCI or AD) (p =0.001). MCI men had significantly lower (p=0.02) plasma leptin (8.31±7.51 ng/mL) than NC men (11.76±9.86 ng/mL). This was not the case for MCI women compared to NC women (20.40±16.91 vs 25.22±17.9 ng/ml, p=0.18) unless only women of BMI <27 were included for the comparison (13.72±9.88 vs 20.31±17.71 ng/ml, p=0.02, not shown).
Figure 2
Figure 2. Relationship Between Plasma Leptin and BMI According to Gender
Plasma leptin levels correlate with BMI in men (solid circle, R=0.588) and women (empty circle, R 0.645), but women have a greater increase in leptin levels per unit of BMI change than men.
Figure 3
Figure 3. Linear Correlations Between Plasma Leptin Levels and BMI According to Diagnosis in Men, Women and Women with BMI<27
In the mixed linear models, plasma leptin level was the dependent variable, with age, presence of APOE4 allele, BMI, diagnostic category, and the interaction between diagnostic category and BMI as fixed variables, and BMI as a random variable. Men (Panel A) with normal cognition experience greater change in leptin levels per BMI unit change than men with MCI or AD (p=0.041). This was not true in women (Panel B), except for those with BMI<27 (Panel C). Green line: NC; orange line: MCI; black line: AD.
Figure 4
Figure 4. Relationship Between CSF Leptin and Plasma Leptin for Men and Women
Scatchard plots showing CSF leptin versus plasma leptin levels for all men (A) and all women (B). The mean plasma leptin: CSF leptin ratios for men were 101.42±31.94, 86.22±42.87 and 74.97±36.68 for NC, MCI and AD respectively. These values were 112.13±46.75, 93.28±42.60 and 98.84±56.84 for the corresponding groups of women. The curve of all data points is logarithmic, depicting saturability of CSF leptin levels at high plasma levels. Generally, the ratio of plasma versus CSF leptin was similar across groups and genders. However, a significant lower ratio was found in men, but not women, with AD (74.97±36.68) compared to NC (101.42±31.94) (p=0.008), indicating that at least transport of leptin into the brain is not affected by the disease. In obesity, this ratio becomes larger compared to controls, possibly due to transporter saturability.
Figure 5
Figure 5. CSF Biomarker Profile for NC, MCI, Lowest Leptin Quartile MCI(q1) and AD
CSF biomarkers Aβ1-42, p-Tau181 and Tau are plotted for men (A-C) and women (D-F) for the ADNI-1 participants (Normal (N), MCI, AD) with plasma leptin determinations. The lowest–Leptin quartile within the MCI was also plotted separately (MCI(q1)). Data represent the mean±SD. There were no significant differences between the non NC groups despite a trend in increasing abnormalities from NC to MCI to MCI(q1) to AD. However, each group was significantly different compared to NC (p<0.006). The trend was more apparent for p-Tau181 in both, men and women (B,E), Aβ1-42 for men (A) and tau for women (F).
Figure 6
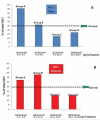
Figure 6. Approximately 70% of MCI Subjects Have Plasma Leptin Values Lower Than the Median Leptin Value of Normal Elderly
The range of plasma leptin values found in the quartiles in normal men and women from ADNI (Panel A) were used to divide the MCI men and women into four groups (Panel B, groups A-D), corresponding to Q1-Q4 of normal quartiles respectively (Panel A). In Panel B, Groups A and B combined represent the percent of MCI subjects with leptin values lower than the median values of leptin in normals (9.8 ng/ml for men and 23 ng/ml for women).

Similar articles

Cited by

References

    1. Greco SJ, Sarkar S, Casadesus G, Zhu X, Smith MA, Ashford JW, et al. Leptin inhibits glycogen synthase kinase-3beta to prevent tau phosphorylation in neuronal cells. Neurosci Lett. 2009;455(3):191–4. - PMC - PubMed
    1. Greco SJ, Sarkar S, Johnston JM, Tezapsidis N. Leptin regulates tau phosphorylation and amyloid through AMPK in neuronal cells. Biochem Biophys Res Commun. 2009;380(1):98–104. - PMC - PubMed
    1. Fewlass DC, Noboa K, Pi-Sunyer FX, Johnston JM, Yan SD, Tezapsidis N. Obesity-related leptin regulates Alzheimer's Abeta. Faseb J. 2004;18(15):1870–8. - PubMed
    1. Greco SJ, Sarkar S, Johnston JM, Zhu X, Su B, Casadesus G, et al. Leptin reduces Alzheimer's disease-related tau phosphorylation in neuronal cells. Biochem Biophys Res Commun. 2008;376(3):536–41. - PMC - PubMed
    1. Friedman JM, Halaas JL. Leptin and the regulation of body weight in mammals. Nature. 1998;395(6704):763–70. - PubMed

Publication types