

A new computational strategy for predicting essential genes
- PMID: 24359534
- PMCID: PMC3880044
- DOI: 10.1186/1471-2164-14-910
A new computational strategy for predicting essential genes
Abstract
Background: Determination of the minimum gene set for cellular life is one of the central goals in biology. Genome-wide essential gene identification has progressed rapidly in certain bacterial species; however, it remains difficult to achieve in most eukaryotic species. Several computational models have recently been developed to integrate gene features and used as alternatives to transfer gene essentiality annotations between organisms.
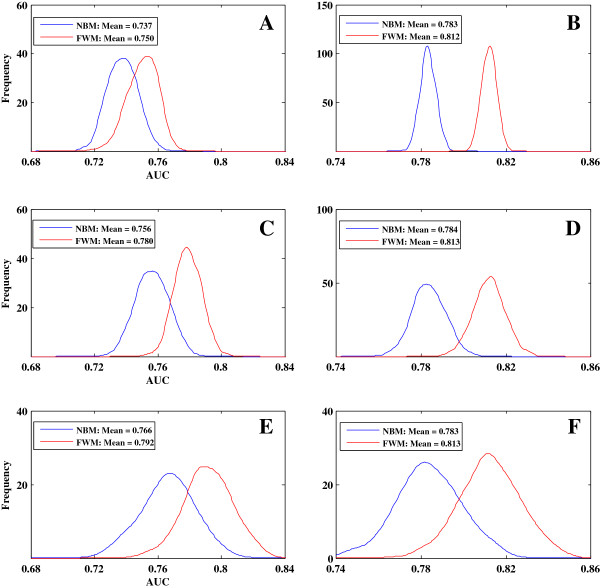
Results: We first collected features that were widely used by previous predictive models and assessed the relationships between gene features and gene essentiality using a stepwise regression model. We found two issues that could significantly reduce model accuracy: (i) the effect of multicollinearity among gene features and (ii) the diverse and even contrasting correlations between gene features and gene essentiality existing within and among different species. To address these issues, we developed a novel model called feature-based weighted Naïve Bayes model (FWM), which is based on Naïve Bayes classifiers, logistic regression, and genetic algorithm. The proposed model assesses features and filters out the effects of multicollinearity and diversity. The performance of FWM was compared with other popular models, such as support vector machine, Naïve Bayes model, and logistic regression model, by applying FWM to reciprocally predict essential genes among and within 21 species. Our results showed that FWM significantly improves the accuracy and robustness of essential gene prediction.
Conclusions: FWM can remarkably improve the accuracy of essential gene prediction and may be used as an alternative method for other classification work. This method can contribute substantially to the knowledge of the minimum gene sets required for living organisms and the discovery of new drug targets.
Figures


Similar articles
-
Machine learning approach to gene essentiality prediction: a review.Brief Bioinform. 2021 Sep 2;22(5):bbab128. doi: 10.1093/bib/bbab128. Brief Bioinform. 2021. PMID: 33842944 Review.
-
Training set selection for the prediction of essential genes.PLoS One. 2014 Jan 22;9(1):e86805. doi: 10.1371/journal.pone.0086805. eCollection 2014. PLoS One. 2014. PMID: 24466248 Free PMC article.
-
DeepHE: Accurately predicting human essential genes based on deep learning.PLoS Comput Biol. 2020 Sep 16;16(9):e1008229. doi: 10.1371/journal.pcbi.1008229. eCollection 2020 Sep. PLoS Comput Biol. 2020. PMID: 32936825 Free PMC article.
-
Selection of key sequence-based features for prediction of essential genes in 31 diverse bacterial species.PLoS One. 2017 Mar 30;12(3):e0174638. doi: 10.1371/journal.pone.0174638. eCollection 2017. PLoS One. 2017. PMID: 28358836 Free PMC article.
-
Advances and perspectives in computational prediction of microbial gene essentiality.Brief Funct Genomics. 2017 Mar 1;16(2):70-79. doi: 10.1093/bfgp/elv063. Brief Funct Genomics. 2017. PMID: 26857942 Review.
Cited by
-
Network-based features enable prediction of essential genes across diverse organisms.PLoS One. 2018 Dec 13;13(12):e0208722. doi: 10.1371/journal.pone.0208722. eCollection 2018. PLoS One. 2018. PMID: 30543651 Free PMC article.
-
Machine learning methods for predicting essential metabolic genes from Plasmodium falciparum genome-scale metabolic network.PLoS One. 2024 Dec 23;19(12):e0315530. doi: 10.1371/journal.pone.0315530. eCollection 2024. PLoS One. 2024. PMID: 39715240 Free PMC article.
-
A Comprehensive Overview of Online Resources to Identify and Predict Bacterial Essential Genes.Front Microbiol. 2017 Nov 27;8:2331. doi: 10.3389/fmicb.2017.02331. eCollection 2017. Front Microbiol. 2017. PMID: 29230204 Free PMC article. Review.
-
Predicting Essential Genes and Proteins Based on Machine Learning and Network Topological Features: A Comprehensive Review.Front Physiol. 2016 Mar 8;7:75. doi: 10.3389/fphys.2016.00075. eCollection 2016. Front Physiol. 2016. PMID: 27014079 Free PMC article. Review.
-
Bacterial genome reductions: Tools, applications, and challenges.Front Genome Ed. 2022 Aug 31;4:957289. doi: 10.3389/fgeed.2022.957289. eCollection 2022. Front Genome Ed. 2022. PMID: 36120530 Free PMC article. Review.
References
-
- Yu H, Greenbaum D, Lu HX, Zhu X, Gerstein M. Genomic analysis of essentiality within protein networks. RNA. 2004;14:817–846. - PubMed
Publication types
MeSH terms
LinkOut - more resources
Full Text Sources
Other Literature Sources
Molecular Biology Databases
