. 2013 Dec 20;14(12):R140.
doi: 10.1186/gb-2013-14-12-r140.

Spatial expression of transcription factors in Drosophila embryonic organ development

Spatial expression of transcription factors in Drosophila embryonic organ development

Ann S Hammonds et al. Genome Biol. .

Abstract

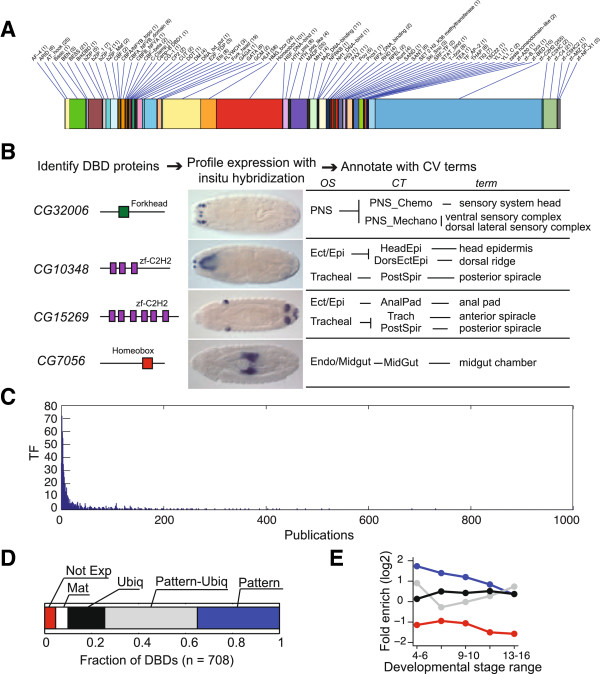
Background: Site-specific transcription factors (TFs) bind DNA regulatory elements to control expression of target genes, forming the core of gene regulatory networks. Despite decades of research, most studies focus on only a small number of TFs and the roles of many remain unknown.

Results: We present a systematic characterization of spatiotemporal gene expression patterns for all known or predicted Drosophila TFs throughout embryogenesis, the first such comprehensive study for any metazoan animal. We generated RNA expression patterns for all 708 TFs by in situ hybridization, annotated the patterns using an anatomical controlled vocabulary, and analyzed TF expression in the context of organ system development. Nearly all TFs are expressed during embryogenesis and more than half are specifically expressed in the central nervous system. Compared to other genes, TFs are enriched early in the development of most organ systems, and throughout the development of the nervous system. Of the 535 TFs with spatially restricted expression, 79% are dynamically expressed in multiple organ systems while 21% show single-organ specificity. Of those expressed in multiple organ systems, 77 TFs are restricted to a single organ system either early or late in development. Expression patterns for 354 TFs are characterized for the first time in this study.

Conclusions: We produced a reference TF dataset for the investigation of gene regulatory networks in embryogenesis, and gained insight into the expression dynamics of the full complement of TFs controlling the development of each organ system.


Figures

Figure 1
Figure 1
Systematic profiling of TF mRNA embryonic expression patterns. (A) Distribution of 708 TF genes by DBD class sorted alphabetically with the number in each class in parentheses. (B) Expression profiling pipeline and downstream analysis. Four examples of previously uncharacterized TFs showing the TF gene name, an illustration of the defining DBD, an in situ image for the gene, and annotations showing primary controlled vocabulary primary annotation terms (term), the associated collapsed terms (CT), and the organ system (OS). (C) Histogram showing the density of publications per TF as shown by the number of publications recorded in FlyBase TF gene reports (x-axis) in relation to the number of TFs (y-axis). Most TFs are concentrated around the x-axis origin, that is, referenced in a small number of publications. (D) Distribution of TFs into expression classes. We classified TFs as either not expressed (Not Exp), maternally deposited only (Mat: expression for gene observed at S1-3 and may persist for the next two stage ranges), ubiquitous-only (Ubiq: gene shows only ubiquitous staining at all stages expressed, with no anatomic terms annotated), patterned-only (Pattern: gene is assigned to a tissue term at all stages expressed), patterned-and-ubiquitous (Pattern-Ubiq: gene shows ubiquitous-only staining at one or more stages and pattern annotations in others, or a pattern with a weaker ubiquitous background). (E) Fold enrichment of fraction of TF vs. all genes (7,042) at each stage-range across expression classes. Color code for expression class is as in 1D.
Figure 2
Figure 2
Organ system relationships and TF count by organ system. Number of TFs expressed at each stage for the sixteen organ systems. Colored circles show stage range when each organ system becomes detectable and connecting lines show developmental relationships between organ systems. Stage ranges are shown on the bottom line with corresponding developmental time in hours above. The two numbers on the right indicate the total number of TFs (Total) expressed in each organ system and the subset (u) representing TFs that were previously uncharacterized, or uncharacterized in embryonic development. See text for organ system descriptions.
Figure 3
Figure 3
Summary of TF enrichment within collapsed tissue annotation terms. Enrichment of the fraction of TFs vs. All genes for collapsed annotation terms at each stage-range. Each annotation term is represented as a box, where the y-axis value is the fold enrichment (FE) and the color indicates the stage range. To highlight the organ system trends, collapsed tissue annotations are grouped by organ systems shown on the x-axis. All the annotation terms that did not show significant enrichment (FDR >0.05) are assigned a fold enrichment of zero and placed in the grey area of the plot. For the Ectoderm, VisualPr, CNS, and Foregut organ systems, the positions of the annotation term boxes are adjusted and linked to the actual FE value, represented as a point. Individual collapsed tissue annotation abbreviations and annotation term mappings are detailed in Additional file 3: Table S3. Short key to terms: ME: mesoderm; HM: head mesoderm; TM: trunk mesoderm; HSM: head somatic mesoderm; HVM: head visceral mesoderm: TSM: trunk somatic mesoderm; TVM: trunk visceral mesoderm; FB: fat body; Pl: plasmatocytes; G: garland cells; CM: cardiac mesoderm: CV: cardiovascular system: RG: ring gland; DE: dorsal ectoderm; VE: ventral ectoderm; HEE: head epidermis; DEE: dorsal ectoderm/epidermis; VEE: ventral ectoderm/epidermis; AP: anal pad; O: oenocyte: T: trachea; PS: posterior spiracle; SG: salivary gland; VP: visual primordium; OL: optic lobe; AE: anterior endoderm; PE: posterior endoderm; AMG; anterior midgut: PMG: posterior midgut; MG: midgut; MT: Malpighian tubules; H: hindgut; Ph: pharynx; FG: foregut; AT: atrium; SNS: stomatogastric nervous system; PCE: procephalic ectoderm; CB: central brain: VC: ventral nerve cord; M: midline; P: PNS-photosensory: MS: PNS-mechanosensory; C: PNS-chemosensory; AI: adult imaginal primordium; PC: pole cell; GC: germ cell; GO: gonad; A: amnioserosa: Y: yolk.
Figure 4
Figure 4
Expression properties of DBD families. Expression categories (PO: patterned only, P-U: patterned-and-ubiquitous, UO: ubiquitous only, MO: maternally deposited only, NE: not-expressed; see Figure 1 legend for descriptions) for 22 DBD families with more than five members each, ordered by fraction of TFs classified as PO. For the purposes of this analysis, bZIP, bZIP_1, and bZIP_2 are grouped as a single DBD family. The number of TFs in each DBD family is indicated in parentheses after the DBD name. For reference, an additional column (All TFs) shows the distribution of all 708 TFs by expression category. See Additional file 1: Table S1 for more information about DBD names, with Pfam and InterPro identifiers.
Figure 5
Figure 5
Self-organizing maps (SOM) of TF expression in organ systems. (A) Portion of the TF expression matrix showing expression (colored boxes) in the appropriate stage ranges for each organ system and highlighting a section (54 of 152 TFs) of the foregut (FoGut) organ system cluster (blue). Rows are TFs and columns are organ systems, with a separate column for each stage range within an organ system (colors identical to Figure 2). The entire expression matrix is used as input to generate the SOM toroidal map. The toroid on the left displays the complete expression composite of all TFs expressed at stage range 13 to 16 and the toroid on the right highlights the FoGut TFs (blue) at the same stage range. The distribution of the FoGut TFs (blue filled circles) in two dimensions is shown in the lower panel. Co-expressed TFs (across all organ systems and all stages) will end up close to each other. (B) CNS TF map showing the dynamics of TF expression in a single organ system during development. The overall number of filled circles (=TFs) increases significantly at later stages, highlighting increased number of TFs and TF complexity. Two examples for TFs with different temporal dynamics are highlighted. (C) TF expression in the Hindgut, Foregut, and Endoderm/Midgut organ systems highlighting the relationships between the three organ systems. Intersecting filled circles (arrows show two examples) indicate expression in multiple systems; for example, at stages 4 to 6 only six TFs are co-expressed Hindgut and Foregut, while co-expression in midgut and hindgut/foregut is more common. (D) TFs in the PNS at stages 13 to 16 (center panel). The boxed region is expanded to the right. (E) Distinct and overlapping groups of TFs active in the PNS and SNS at stages 13 to 16 superimposed with the TFs active in the ectoderm/epidermis stages 4 to 6.
Figure 6
Figure 6
Distribution of TFs as a function of their expression profiles. The colored regions of the pie chart highlight the TFs categorized as consistently expressed in a single organ system (red), temporally restricted early or late in embryonic development to a single organ system (shades of green), or expressed in multiple organ systems (blue). The segments of the pie chart shaded in grey from light to dark are: not expressed (25 TFs), maternally expressed only (34 TFs) and ubiquitously expressed only (114 TFs), respectively. TFs restricted to a single organ system both early and late are listed on the left with the associated organ system. The time line on the right shows the division of early and late development with diagram illustrating development of organ systems at stages 5 (early body plan determination and organ specification), 9 (organ specification nearly complete), and 16 (organ system differentiation).

References

    1. Chang YC, Jang AC, Lin CH, Montell DJ. Castor is required for Hedgehog-dependent cell-fate specification and follicle stem cell maintenance in Drosophila oogenesis. Proc Natl Acad Sci USA. 2013;14:E1734–E1742. doi: 10.1073/pnas.1300725110. - DOI - PMC - PubMed
    1. A user’s guide to the encyclopedia of DNA elements (ENCODE) PLoS Biol. 2011;14:e1001046. doi: 10.1371/journal.pbio.1001046. - DOI - PMC - PubMed
    1. Roy S, Ernst J, Kharchenko PV, Kheradpour P, Negre N, Eaton ML, Landolin JM, Bristow CA, Ma L, Lin MF, Washietl S, Arshinoff BI, Ay F, Meyer PE, Robine N, Washington NL, Di Stefano L, Berezikov E, Brown CD, Candeias R, Carlson JW, Carr A, Jungreis I, Marbach D, Sealfon R, Tolstorukov MY, Will S, Alekseyenko AA, Artieri C, Booth BW. modENCODE Consortium et al.Identification of functional elements and regulatory circuits by Drosophila modENCODE. Science. 2010;14:1787–1797. - PMC - PubMed
    1. Negre N, Brown CD, Ma L, Bristow CA, Miller SW, Wagner U, Kheradpour P, Eaton ML, Loriaux P, Sealfon R, Li Z, Ishii H, Spokony RF, Chen J, Hwang L, Cheng C, Auburn RP, Davis MB, Domanus M, Shah PK, Morrison CA, Zieba J, Suchy S, Senderowicz L, Victorsen A, Bild NA, Grundstad AJ, Hanley D, MacAlpine DM, Mannervik M. et al.A cis-regulatory map of the Drosophila genome. Nature. 2011;14:527–531. doi: 10.1038/nature09990. - DOI - PMC - PubMed
    1. Gerstein MB, Lu ZJ, Van Nostrand EL, Cheng C, Arshinoff BI, Liu T, Yip KY, Robilotto R, Rechtsteiner A, Ikegami K, Alves P, Chateigner A, Perry M, Morris M, Auerbach RK, Feng X, Leng J, Vielle A, Niu W, Rhrissorrakrai K, Agarwal A, Alexander RP, Barber G, Brdlik CM, Brennan J, Brouillet JJ, Carr A, Cheung MS, Clawson H, Contrino S. et al.Integrative analysis of the Caenorhabditis elegans genome by the modENCODE project. Science. 2011;14:1775–1787. - PMC - PubMed

Publication types

MeSH terms

LinkOut - more resources