. 2013 Dec 19;155(7):1507-20.
doi: 10.1016/j.cell.2013.11.039.

Interactome maps of mouse gene regulatory domains reveal basic principles of transcriptional regulation

Affiliations

Interactome maps of mouse gene regulatory domains reveal basic principles of transcriptional regulation

Kyong-Rim Kieffer-Kwon et al. Cell. .

Abstract

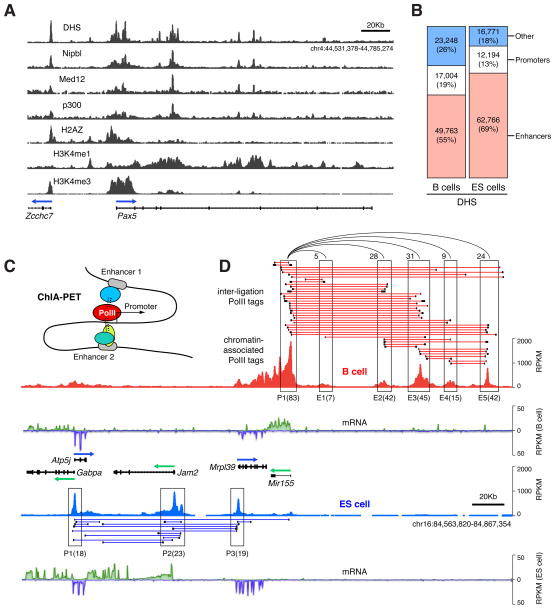
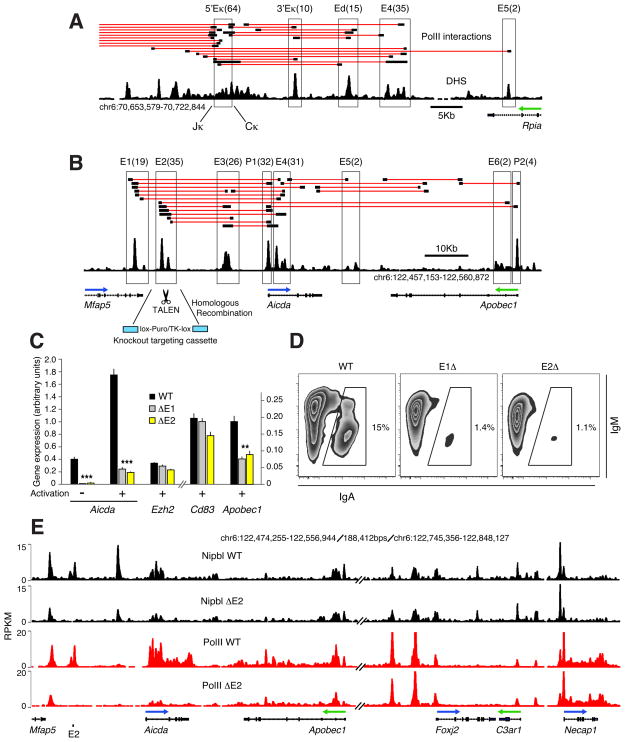
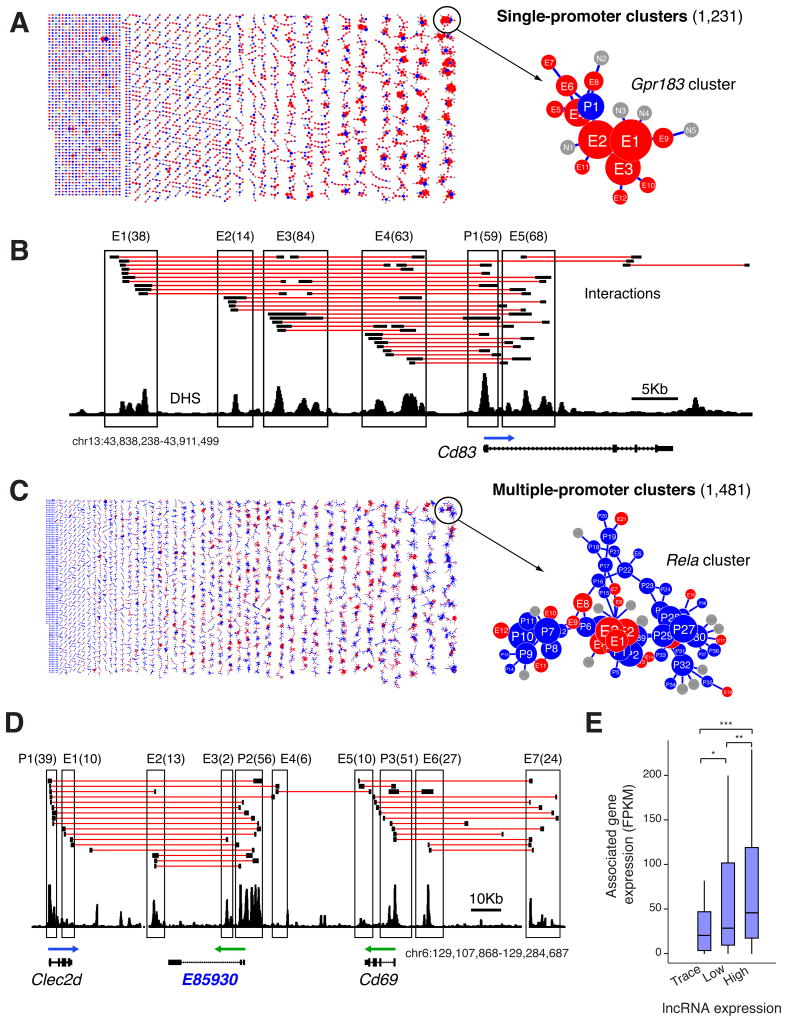
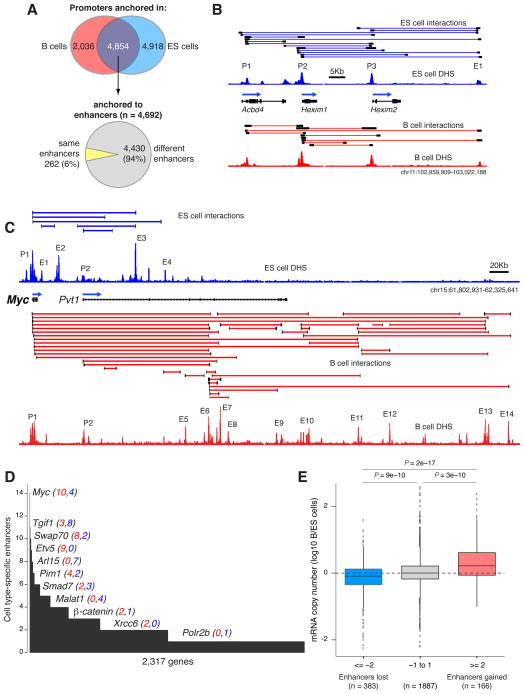
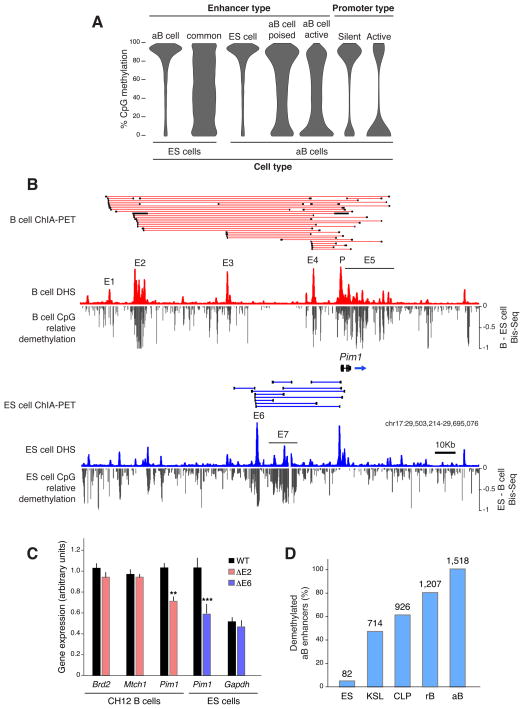
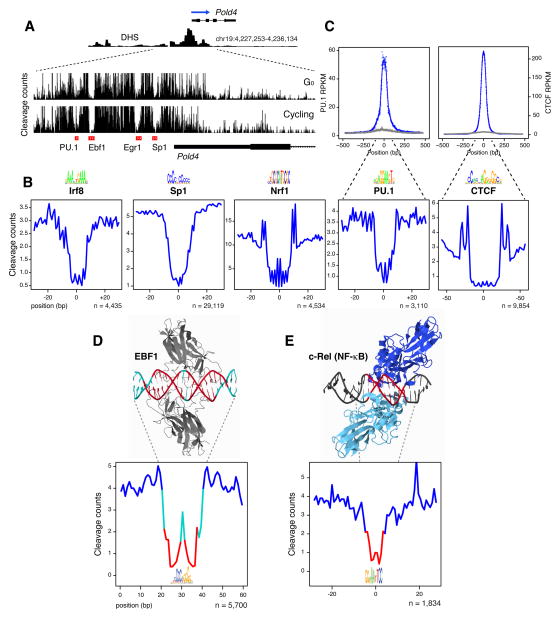
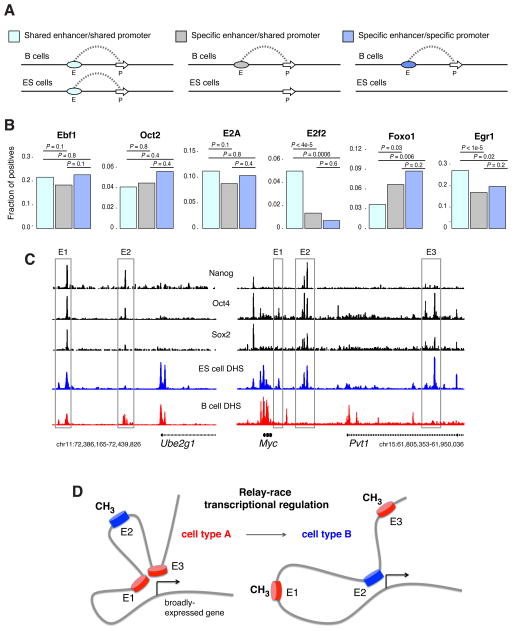
A key finding of the ENCODE project is that the enhancer landscape of mammalian cells undergoes marked alterations during ontogeny. However, the nature and extent of these changes are unclear. As part of the NIH Mouse Regulome Project, we here combined DNaseI hypersensitivity, ChIP-seq, and ChIA-PET technologies to map the promoter-enhancer interactomes of pluripotent ES cells and differentiated B lymphocytes. We confirm that enhancer usage varies widely across tissues. Unexpectedly, we find that this feature extends to broadly transcribed genes, including Myc and Pim1 cell-cycle regulators, which associate with an entirely different set of enhancers in ES and B cells. By means of high-resolution CpG methylomes, genome editing, and digital footprinting, we show that these enhancers recruit lineage-determining factors. Furthermore, we demonstrate that the turning on and off of enhancers during development correlates with promoter activity. We propose that organisms rely on a dynamic enhancer landscape to control basic cellular functions in a tissue-specific manner.


Conflict of interest statement

CONFLICT OF INTEREST STATEMENT

J.K.J. has a financial interest in Transposagen Biopharmaceuticals. J.K.J.’s interests were reviewed and are managed by Massachusetts General Hospital and Partners HealthCare in accordance with their conflict of interest policies.

Figures

Figure 1
Figure 1. Characterization of regulatory domains and their interactions in mouse primary B and ES cells
(A) Pax5 locus in activated B cells displaying DNaseI hypersensitivity (DHS); recruitment of Nipbl, Med12, and p300; and chromatin marks H2AZ, H3K4me1, and H3K4me3. (B) Bar graphs showing the number of DHS islands in B and ES cells overlapping with promoters (TSS+, white), enhancers (TSS−, Nipbl+, or Med12+, or p300+, red), or non-overlapping (blue). (C) The ChIA-PET protocol combines PolII ChIP with conformation capturing techniques to map the interaction of active promoters with gene regulatory domains. (D) Examples of ChIA-PET clusters at the Mir155 locus in activated B cells (red connectors) or ES cells (blue connectors). Each connector links 2 or more long-range interactions (PETs) separated by <500 bps (Figure S2A). ChIP-Seq data are represented as reads per Kb per million sequences (RPKM). Promoters (P) and enhancers (E) are boxed and the number of total PETs is provided in parenthesis. Interactions between enhancers and Mir155 are represented by semi-circle connectors. mRNA expression is provided for B and ES cells as RPKM values (+ strand transcription in green, − strand in blue).
Figure 2
Figure 2. In vivo validation of ChIA-PET by genome editing
(A) ChIA-PET at the Igκ locus identifies previously characterized 5′Eκ, 3′Eκ, and Ed enhancers, as well as new enhancers E4 and E5. Number of PETs associated with each regulatory domain (boxed) are provided in parenthesis. The DHS activated B cell track is also provided (black). (B) Regulatory map of the Aicda-Apobec1 locus in activated B cells. Deletion of selected enhancers (E1 and E2) was carried out in CH12 B cells using knockout targeting cassettes (cyan) and TALEN endonucleases. (C) qPCR analysis of Aicda, Apobec1, Ezh2, and Cd83 expression in wild type (WT), and E1 or E2 deleted (Δ) CH12 cells. Data are represented as the mean +/− SEM (n = 6). P values were < 0.0001 (Aicda), and = 0.008 (Apobec1). (D) Flow cytometry analysis of recombination to IgA in activated WT, ΔE1, or ΔE2 cells. (E) Nipbl (black) and PolII (red) occupancy at the Aicda-Apobec1 and Foxj2-Necap1 loci in WT or ΔE2 cells. The two loci are separated on chromosome 6 by 188kb.
Figure 3
Figure 3. Gene clusters identified by ChIA-PET
(A) Single-promoter clusters in activated B cells connecting 1,231 gene promoters to at least one enhancer. Right: e.g. the Gpr183 promoter (blue circle) is linked to 12 enhancers (red circles) via 76 interactions. PETs anchored outside enhancers are represented with grey circles. Circles are sized according to the absolute number of anchored PETs. (B) Interactions at the Cd83 single gene cluster. (C) Multi-promoter clusters (n = 1,481) identified in B cells. The Rela cluster display 398 interactions involving 66 genes. (D) PolII connections between lncRNA E85930, Clec2d, and Cd69. Promoters and enhancers are boxed and number of PETs are provided in parenthesis. (E) Transcription levels of genes associated with trace (no detectable FPKM), low (<0.9 FPKM), or highly transcribed lncRNAs (≥0.9 FPKM).
Figure 4
Figure 4. Tissue-specific enhancers contribute to the transcriptional regulation of broadly expressed genes
(A) Venn diagram showing the number of ChIA-PET anchored promoters in B cells (left), ES cells (right), or in both cell types (middle). For the latter group, the pie chart below shows the number of promoters linked to the same (yellow) or to at least one cell-type specific enhancer (grey). (B) Acbd4 and Hexim1/2 gene promoters associate with the same downstream enhancer (E1) in B and ES cells. (C) The Myc oncogene is linked to an entirely different set of enhancers in ES (blue) and B (red) cells. Enhancers are numbered from 1–10 based on proximity to the Myc promoter (P1). (D) Genes classified by the total number of tissue specific enhancers they interact with. Individual examples are highlighted and the number of B cell-specific (red) and ES cell-specific (blue) enhancers is provided in parenthesis. (E) Box plot providing changes in mRNA copy number for genes that are anchored both in B and ES cells and that associate with ≤2 ES cell-specific enhancers (blue), ≥2 B cell-specific enhancers (red), or genes in between (grey).
Figure 5
Figure 5. DNA demethylation demarcates differential enhancer usage
(A) CpG methylation at regulatory elements in B and ES cells. (B) DNA demethylation at the Pim1 mouse locus in B (upper) and ES (lower) cells. Demethylation was calculated by subtracting normalized ES cell methylation values from the activated B cell Bis-Seq and vice versa. (C) Bar graph showing qPCR analysis of Brd2, Mtch1, and Pim1 expression in WT (black) or ΔE2 (red) CH12 cells. Same analysis for WT or ΔE6 (blue) ES cells. Data are represented as the mean +/− SEM (n = 6). Pim1 P < 0.005 in B cells and P < 0.003 in ES cells. (D) Bar graph represents the fraction (%) of 1,518 activated B cell enhancers that are CpG demethylated in ES, KSL, CLP, and G0 resting (r) B cells. Absolute numbers of demethylated enhancers are provided on top of each bar.
Figure 6
Figure 6. Digital genomic footprinting
(A) Characterization of footprints at the Pold4 promoter in primary resting or cycling CH12 B cells. Transcription factor binding motifs overlapping with each footprint are shown below the graph (red rectangles). Tracks were configured to display the maximum (light grey) and one standard deviation above the mean (dark grey). (B) Examples of footprints overlapping with Irf8, Sp1, Nrf1, PU.1, and CTCF DNA recognition motifs. (C) Composite of PU.1 and CTCF ChIP-Seq (blue data points, upper graphs) and cumulative footprinting (lower graphs) associated with cognate binding motifs (middle logos) in B cells. The absolute number of motif occurrences is provided. Grey data points represent ChIP-seq signals at footprints not associated with PU.1 or CTCF motifs. (D) The co-crystal structure of Ebf1 bound to its DNA ligand is compared to its cognate footprint profile. Motif nucleotides least sensitive to cleavage are depicted in red; most sensitive residues are depicted in cyan. (E) Similar analysis as in panel D for the NFκB-cRel dimer.
Figure 7
Figure 7. Distribution of transcription factor binding across the B and ES cell genome
(A) Classification of B and ES cell enhancers into those present in both cell types and associated with shared promoters (light blue), cell-type specific enhancers associated with broadly active promoters (grey), and cell-specific enhancers associated with cell-specific promoters (blue). (B) Fraction of each enhancer type harboring a particular motif in a footprint. (C) ChIP-Seq analysis of pluripotent factors Nanog, Oct4, and Sox2 at the Ube2g1 and Myc gene loci. (D) Transcription of broadly-expressed genes is driven during development by a relay-race type of regulation, where the landscape of active enhancers varies in different cell types concomitant with the dynamics of CpG methylation.

References

    1. Baek S, Sung MH, Hager GL. Quantitative analysis of genome-wide chromatin remodeling. Methods Mol Biol. 2012;833:433–441. - PMC - PubMed
    1. Batista PJ, Chang HY. Long noncoding RNAs: cellular address codes in development and disease. Cell. 2013;152:1298–1307. - PMC - PubMed
    1. Buecker C, Wysocka J. Enhancers as information integration hubs in development: lessons from genomics. Trends Genet. 2012;28:276–284. - PMC - PubMed
    1. Bultmann S, Morbitzer R, Schmidt CS, Thanisch K, Spada F, Elsaesser J, Lahaye T, Leonhardt H. Targeted transcriptional activation of silent oct4 pluripotency gene by combining designer TALEs and inhibition of epigenetic modifiers. Nucleic Acids Res. 2012;40:5368–5377. - PMC - PubMed
    1. Casellas R, Jankovic M, Meyer G, Gazumyan A, Luo Y, Roeder R, Nussenzweig M. OcaB is required for normal transcription and V(D)J recombination of a subset of immunoglobulin kappa genes. Cell. 2002;110:575–585. - PubMed

Publication types

LinkOut - more resources