. 2013 Dec 19;155(7):1521-31.
doi: 10.1016/j.cell.2013.11.033.

Rapid and pervasive changes in genome-wide enhancer usage during mammalian development

Affiliations

Rapid and pervasive changes in genome-wide enhancer usage during mammalian development

Alex S Nord et al. Cell. .

Abstract

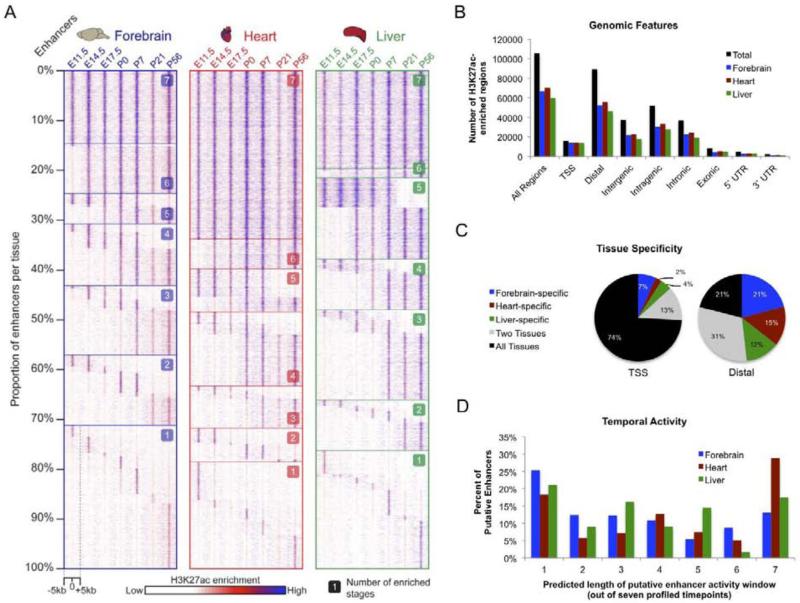
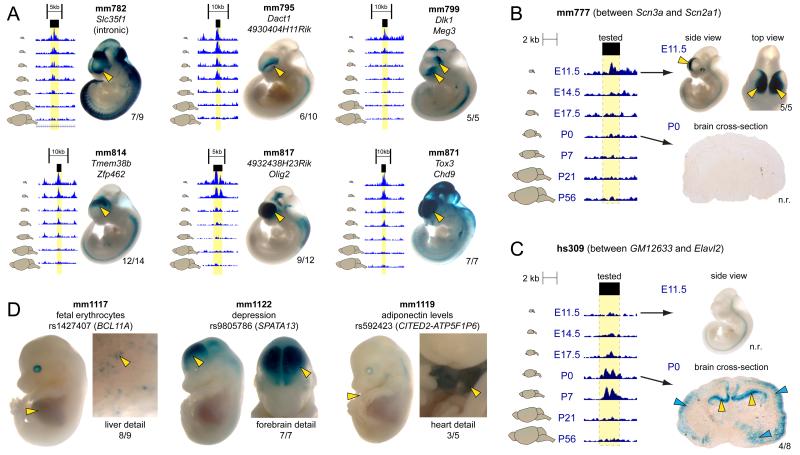
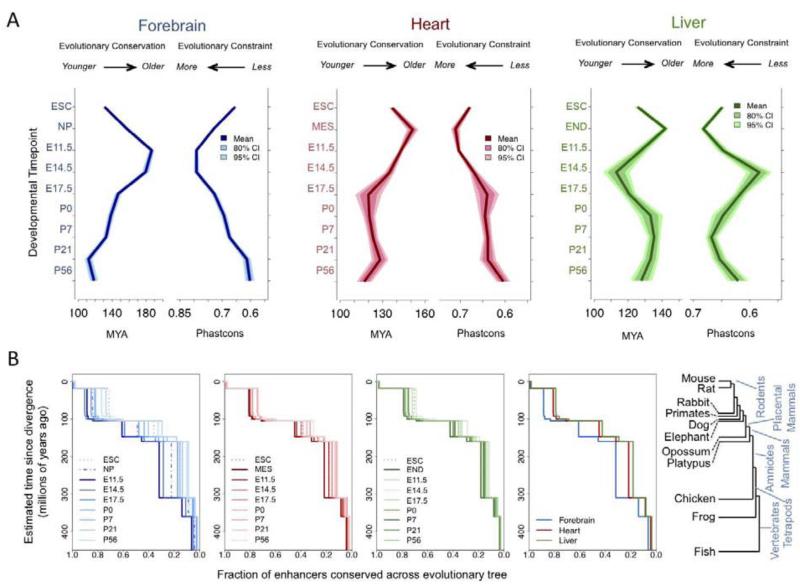
Enhancers are distal regulatory elements that can activate tissue-specific gene expression and are abundant throughout mammalian genomes. Although substantial progress has been made toward genome-wide annotation of mammalian enhancers, their temporal activity patterns and global contributions in the context of developmental in vivo processes remain poorly explored. Here we used epigenomic profiling for H3K27ac, a mark of active enhancers, coupled to transgenic mouse assays to examine the genome-wide utilization of enhancers in three different mouse tissues across seven developmental stages. The majority of the ∼90,000 enhancers identified exhibited tightly temporally restricted predicted activity windows and were associated with stage-specific biological functions and regulatory pathways in individual tissues. Comparative genomic analysis revealed that evolutionary conservation of enhancers decreases following midgestation across all tissues examined. The dynamic enhancer activities uncovered in this study illuminate rapid and pervasive temporal in vivo changes in enhancer usage that underlie processes central to development and disease.


Figures

Figure 1
Figure 1. Mapping in vivo enhancers via ChIP-seq performed on mouse forebrain, heart, and liver tissue
A Schematic of developmental stages and tissues. B Representative examples of putative enhancers exhibiting dynamic H3K27ac signal across tissues and timepoints. Text includes description of loci. (See also Supplementary Figs. 1 & 2; Supplementary Tab. 1).
Figure 2
Figure 2. Developmental enhancers exhibit dynamic H3K27ac enrichment associated with in vivo activity
A. Heatmap displaying H3K27ac enrichment by tissue and timepoint for putative distal enhancers (forebrain n=52,175; heart n=55,869; liver n=46,062). For each tissue, each row of the heatmap shows relative H3K27ac enrichment at one enhancer, with signal across the surrounding 10kb region plotted. Enhancers are organized by the number of timepoints at which the enhancer is active, starting with constitutively active enhancers at the top and proceeding down to single-stage enhancers at the bottom. B. Breakdown on H3K27ac enrichment across genomic features. C. Tissue specificity for TSS and distal H3K27ac enrichment. D. Predicted length of putative distal enhancer activity based on H3K27ac enrichment across seven profiled timepoints. (See also Supplementary Fig. 2).
Figure 3
Figure 3. In vivo validation of H3K27ac-predicted enhancer activity
Candidate enhancers were cloned into a vector containing a minimal promoter and the LacZ reporter gene and injected into fertilized mouse oocytes. Multiple transgenic mice with independent enhancer integration events were examined to assess the reproducibility of any given reporter activity pattern. Yellow arrows and numbers next to embryos/sections indicate reproducibility of staining across transgenic individuals. Additional embryo images for each element can be viewed in the VISTA Enhancer Database (http://enhancer.lbl.gov). n.r: not reproducible. A-C. In vivo validation of predicted forebrain enhancers. Forebrain H3K27ac signal across timepoints shown to the left, with yellow highlighting indicating the tested region. A. Six representative enhancers that exhibit diverse forebrain activity patterns at E11.5. B. Enhancer located near Scn2a1 that shows transient H3K27ac enrichment and drives in vivo expression at E11.5, but not P0. C Enhancer upstream of Elavl2 that shows transient enrichment and in vivo activity at P0, but not E11.5.;Blue arrows indicate non-reproducible staining. D. Three representative enhancers active at E14.5 that overlap with lead GWAS SNPs. GWAS phenotype, lead SNP ID, and potential gene of interest are listed. (See also Supplementary Figs. 3-5).
Figure 4
Figure 4. Association of developmental enhancers with functional pathways, mouse phenotypes, and transcription factor binding motifs
Each heatmap displays results from enrichment analysis performed on forebrain, heart, and liver enhancers active at specified timepoints. A. Ten representative differentially enriched GO biological functions, MGI mouse phenotypes, and known transcription factor binding motifs selected from the complete enrichment datasets. B. Full enrichment dataset heatmaps for GO biological functions (n=827), MGI mouse phenotypes (n=922), and known transcription factor binding motifs (n=215). Annotation terms and TF motifs were hierarchically clustered by enrichment patterns. Differential enrichment across tissues and timepoints occurs widely across the full datasets
Figure 5
Figure 5. Developmental signatures of enhancer evolution
The tissue-based enhancer set was expanded to include cell lines used as proxies for early development: embryonic stem cells (ESC), neural progenitors (NP), mesoderm (MES), and mesoendoderm (END).A. Mean and 95% and 80% confidence intervals of evolutionary age (left panel) and constraint (right panel) by tissue and timepoint. B. Cumulative proportion of enhancers conserved across the vertebrate tree (shown on right) as defined by enhancer sequence homology. Plots shown for all timepoints in each individual tissue in the first three panels, with higher mean conservation indicated by darker shades. Far right panel shows differences across tissues at the most constrained stage for each tissue. (See also Supplementary Figs. 6 & 7).

References

    1. Akamatsu W, Okano HJ, Osumi N, Inoue T, Nakamura S, Sakakibara S, Miura M, Matsuo N, Darnell RB, Okano H. Mammalian ELAV-like neuronal RNA-binding proteins HuB and HuC promote neuronal development in both the central and the peripheral nervous systems. Proc. Natl. Acad. Sci. U.S.a. 1999;96:9885–9890. - PMC - PubMed
    1. Albrieux M, Platel J-C, Dupuis A, Villaz M, Moody WJ. Early expression of sodium channel transcripts and sodium current by cajal-retzius cells in the preplate of the embryonic mouse neocortex. J. Neurosci. 2004;24:1719–1725. - PMC - PubMed
    1. Austin CP, Cepko CL. Cellular migration patterns in the developing mouse cerebral cortex. Development. 1990;110:713–732. - PubMed
    1. Bergsland M, Ramsköld D, Zaouter C, Klum S, Sandberg R, Muhr J. Sequentially acting Sox transcription factors in neural lineage development. Genes Dev. 2011;25:2453–2464. - PMC - PubMed
    1. Bhatnagar P, Purvis S, Barron-Casella E, DeBaun MR, Casella JF, Arking DE, Keefer JR. Genome-wide association study identifies genetic variants influencing F-cell levels in sickle-cell patients. J. Hum. Genet. 2011;56:316–323. - PMC - PubMed

Publication types

Associated data