. 2013 Dec 19;155(7):1596-609.
doi: 10.1016/j.cell.2013.11.030.

Microglia promote learning-dependent synapse formation through brain-derived neurotrophic factor

Affiliations

Microglia promote learning-dependent synapse formation through brain-derived neurotrophic factor

Christopher N Parkhurst et al. Cell. .

Abstract

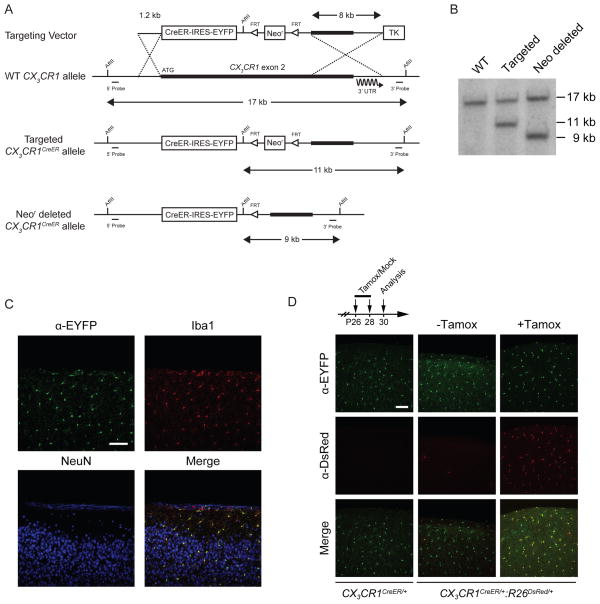
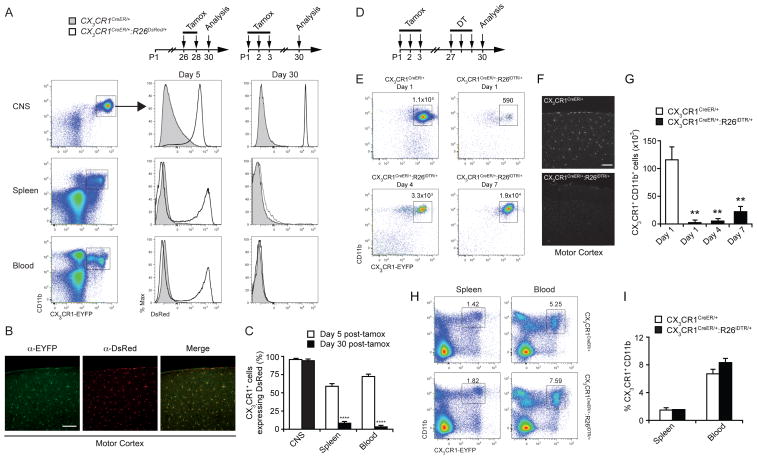
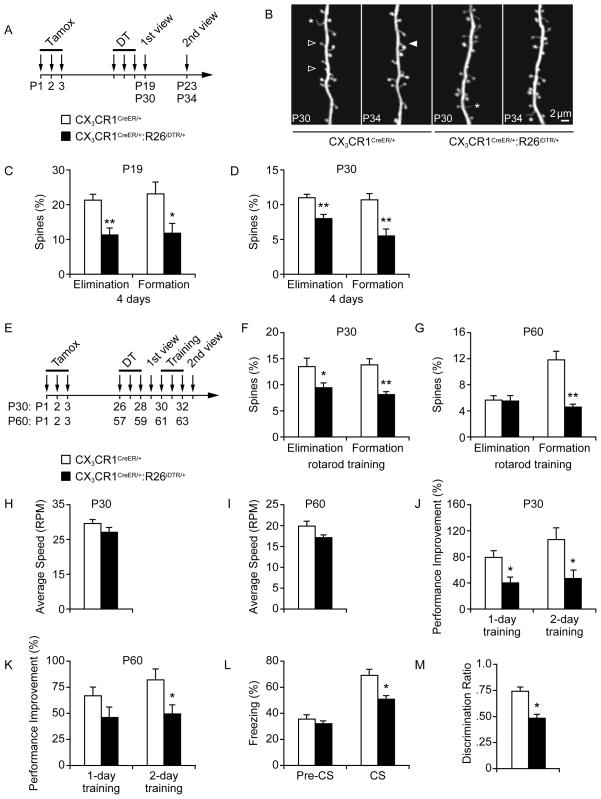
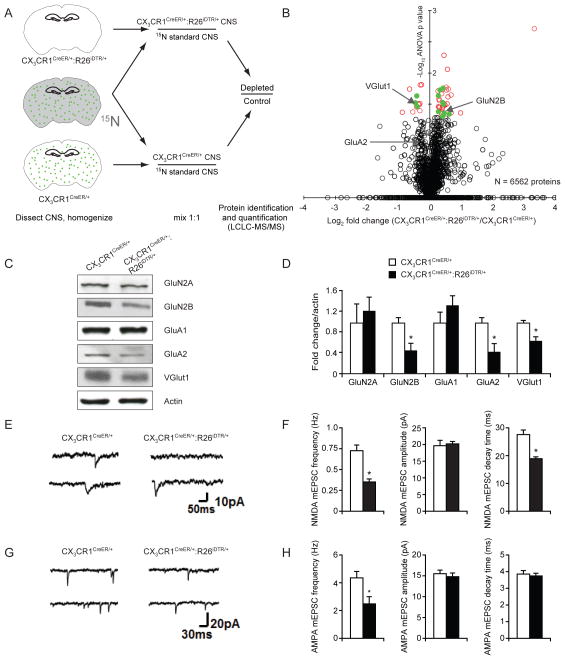
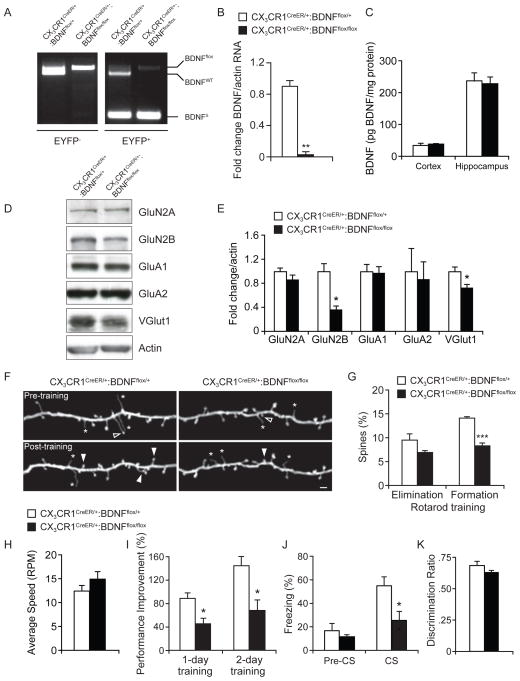
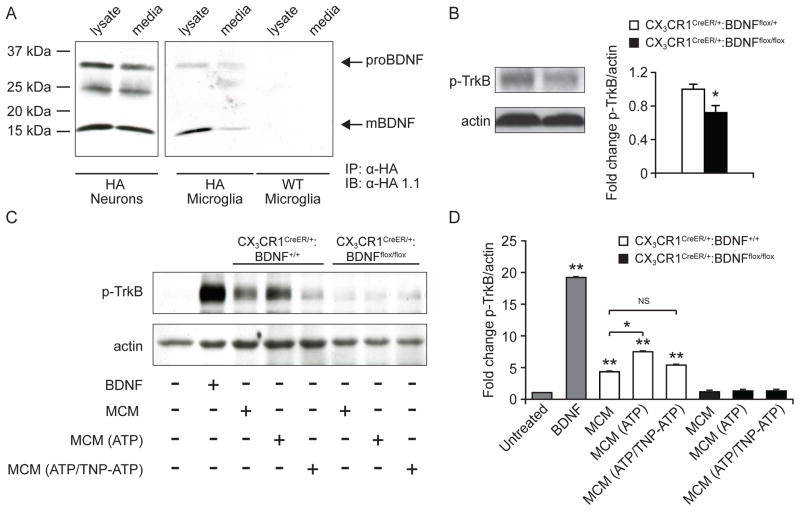
Microglia are the resident macrophages of the CNS, and their functions have been extensively studied in various brain pathologies. The physiological roles of microglia in brain plasticity and function, however, remain unclear. To address this question, we generated CX3CR1(CreER) mice expressing tamoxifen-inducible Cre recombinase that allow for specific manipulation of gene function in microglia. Using CX3CR1(CreER) to drive diphtheria toxin receptor expression in microglia, we found that microglia could be specifically depleted from the brain upon diphtheria toxin administration. Mice depleted of microglia showed deficits in multiple learning tasks and a significant reduction in motor-learning-dependent synapse formation. Furthermore, Cre-dependent removal of brain-derived neurotrophic factor (BDNF) from microglia largely recapitulated the effects of microglia depletion. Microglial BDNF increases neuronal tropomyosin-related kinase receptor B phosphorylation, a key mediator of synaptic plasticity. Together, our findings reveal that microglia serve important physiological functions in learning and memory by promoting learning-related synapse formation through BDNF signaling.


Figures

Figure 1
Figure 1. Generation of mice carrying the CX3CR1CreER allele
(A) Schematic of targeting strategy used for knock-in of CreER-IRES-YFP at the CX3CR1 locus. (B) Southern blot analysis of AflII digested genomic DNA from untargeted (WT), CX3CR1CreER targeted, or CX3CR1CreER mice after deletion of the neomycin resistance sequence. (C) Coronal sections of motor cortex from P45 CX3CR1CreER mice stained for EYFP, Iba1, and NeuN. (D) Coronal sections of motor cortex from mice of the indicated genotypes and treatments (scale bar = 100 μm).
Figure 2
Figure 2. A strategy to restrict Cre-mediated manipulation of gene function including deletion of microglia
(A) CX3CR1-EYFP+ CD11b+ populations in various tissues from mice of the indicated genotypes 5 or 30 days post-tamoxifen treatment. (B) Coronal sections of motor cortex from CX3CR1CreER/+:R26DsRed/+ mice stained for EYFP and DsRed 30 days after tamoxifen treatment. (C) Quantification of flow cytometry fluorescence-activated cell sorting (FACS)analysis showing the percentage of CX3CR1-EYFP+ cells co-expressing DsRed in multiple tissues at 5 or 30 days post-tamoxifen treatment. (D) Time-course of tamoxifen/DT administration and analysis. (E) FACS analysis of microglia in the brain of control and microglia-depleted mice at indicated time points after DT administration. Dot plots show total number of CX3CR1-EYFP+ CD11b+ cells gated on DAPI CD3 CD19 CD45int. (F) Coronal sections of motor cortex from control or microglia-depleted mice stained for Iba1 one day after DT administration. (G) Number of CX3CR1-EYFP+ CD11b+ microglia in the brain after DT administration at various time-points. (H) FACS analysis showing percentage of CX3CR1-EYFP+ CD11b+ cells in the spleen and blood of mice after DT administration. (I) Quantification of data shown in (H). n=4 animals for each experimental condition. Data are represented as mean +/− SEM. ****p<0.0001, *p<0.05; Scale bar= 100 μm. See also Figures S1, S2, S3.
Figure 3
Figure 3. Microglia are important for learning-dependent spine remodeling and performance improvement
(A) Timeline of tamoxifen/DT administration and in vivo imaging in CX3CR1-iDTR mice. (B) Transcranial two-photon imaging of dendritic spines in control and microglia-depleted mice. Filled and empty arrowheads indicate spines formed or eliminated between two views. Asterisk indicates filopodia. (C–D) Percentage of spines formed or eliminated within 4 days in the motor cortex was significantly reduced after microglia depletion in both P19 (C) and P30 animals (*p<0.05, **p<0.01, n=4–6). (E) Timeline of tamoxifen/DT administration, rotarod training, and in vivo imaging. (F) Motor learning-related spine remodeling was significantly reduced in P30 mice with microglia depletion (*p<0.05, **p<0.01, n=4–5). (G) Motor learning-related spine formation was significantly reduced in P60 mice with microglia depletion (**p<0.01, n=4–5). (H) Average speed reached during the first rotarod training session in P30 mice (n=6–7). (I) Average speed reached during the first rotarod training session in P60 mice (n=8). (J) Microglia-depleted mice showed impaired performance improvement compared to non-depleted control mice over one or two days of training (*p<0.05, n=6–7). (K) P60 microglia-depleted mice showed impaired performance improvement compared to non-depleted control mice over one or two days of training (*p<0.05, n=8). (L) Percentage of freezing in control or microglia-depleted mice before (pre-CS) and during (CS) presentation of the conditioned stimulus in the recall test (*p<0.05, n=8) (M) Discrimination ratio of time spent interacting with a novel object vs. a familiar object in a novel object recognition assay was significantly altered in microglia-depleted mice (*p<0.05, n=8). Data are represented as mean +/− SEM. See also Figure S4.
Figure 4
Figure 4. Biochemical and electrophysiological properties of synapses are altered in microglia-depleted brains
(A) Quantitative proteomic scheme to identify CNS proteins altered after microglial depletion. Control (n=3) or microglia-depleted (n=3) brain homogenates were mixed 1:1 with 15N internal standard and were prepared together. Samples were then analyzed by LCLC-MS/MS shotgun proteomics. Green dots represent microglia. (B) Proteomic summary volcano plot (x-axis=log2 CX3CR1CreER/+/CX3CR1CreER/+:R26iDTR/+, y-axis=−log10 ANOVA p value). Black open circles: quantified proteins, red open circles: significantly altered proteins, green filled circles: significantly altered proteins with known synaptic functions. (C) Synaptosome fractions from control or microglia-depleted brains probed with indicated antibodies by Western blot. (D) Densitometric quantification of Western blots in (C) (*p<0.05, n=6). (E) Examples of NMDA mEPSCs in layer V pyramidal neurons from control and microglia-depleted mice. (F) Average NMDA mEPSC frequency, amplitude and decay time in control (n=17 cells) and microglia-depleted mice (n=17 cells). mEPSC frequency and decay time were significantly reduced in microglia-depleted mice (p<0.001). (G) Examples of AMPA mEPSCs in layer V pyramidal neurons from control and microglia-depleted mice. (H) Average mEPSC frequency, amplitude and decay time in control (n=9 cells) and microglia-depleted mice (n=8 cells). mEPSC frequency was significantly reduced in microglia depleted mice (p<0.05). Data are represented as mean +/− SEM. See also Table S1.
Figure 5
Figure 5. Loss of microglial BDNF results in altered synaptic protein levels, synaptic structural plasticity, and performance improvement after learning
(A) PCR-based analysis of wild-type (BDNFWT), conditional undeleted (BDNFflox), or conditional deleted (BDNFΔ) BDNF alleles from CX3CR1-EYFP and CX3CR1-EYFP+ cells sorted from the CNS of CX3CR1CreER/+:BDNFflox/+ or CX3CR1CreER/+:BDNFflox/flox after tamoxifen treatment. (B) Quantitative real-time PCR analysis of BDNF mRNA isolated from CX3CR1-EYFP+ microglia purified from BDNFflox/+ or BDNFflox/flox mice (**p<0.01, n=3). (C) Average protein levels of total BDNF in the cortex or hippocampus of CX3CR1CreER/+:BDNFflox/+ or CX3CR1CreER/+:BDNFflox/flox mice as measured by ELISA (n=4). (D) Synaptosome fractions from the brains of CX3CR1CreER/+:BDNFflox/+ or CX3CR1CreER/+:BDNFflox/flox mice probed with indicated antibodies. (E) Densitometric quantification of western blots in (D) (*p<0.05, n=6). (F) Transcranial two-photon imaging of dendritic spines in Thy1 YFP mice crossed with CX3CR1CreER/+:BDNFflox/+ or CX3CR1CreER/+:BDNFflox/flox mice before or after rotarod training. Filled and empty arrowheads indicate spines formed or eliminated between two views. Asterisk indicates filopodia. Scale bar= 2 μm. (G) Percentage of existing spines eliminated, or new spines formed over 2 days of training in the motor cortex of BDNFflox/+ or BDNFflox/flox mice (***p<0.001, n=4). (H) Average speed reached during the first rotarod training session (n=5–7). (I) Performance increase in motor learning task over 1 or 2 days of rotarod training (*p<0.05, error bars= SEM, n=5–7). (J) Percentage of freezing in control CX3CR1CreER/+:BDNFflox/+ or CX3CR1CreER/+:BDNFflox/flox mice before (pre-CS) and during (CS) presentation of the conditioned stimulus in the recall test (*p<0.05, n=6–7) (K) Discrimination ratio of time spent interacting with a novel object vs. a familiar object in a novel object recognition assay was significantly altered in mice depleted of microglial BDNF (*p<0.05, n=8). Data are represented as mean +/− SEM. See also Figure S5.
Figure 6
Figure 6. Microglia produce both pro and mature BDNF to phosphorylate neuronal TrkB
(A) Neurons or microglia were cultured from P1 mice from BDNF-HA or WT animals. Cell lysates or culture media were immmunoprecipitated (IP) with a rabbit antibody to HA. Pro-BDNF and mature BDNF were detected by immunoblotting with a second antibody to HA (mouse HA1.1). (B) Synaptosome westerns for p-TrkB from CX3CR1CreER/+:BDNFflox/+ or CX3CR1CreER/+:BDNFflox/flox mice (*p<0.05, n=6). (C) Representative immunoblots of E18 rat neurons at DIV 8 treated as indicated. (D) Densitometric quantification of p-TrkB western blots in (C) (*p<0.05, **p<0.005, n=9). Data are represented as mean +/− SEM. See also Figure S6.

Comment in

References

    1. Ajami B, Bennett JL, Krieger C, Tetzlaff W, Rossi FMV. Local self-renewal can sustain CNS microglia maintenance and function throughout adult life. Nat Neurosci. 2007;10:1538–1543. - PubMed
    1. Bailey CH, Kandel ER. Structural changes accompanying memory storage. Annu Rev Physiol. 1993;55:397–426. - PubMed
    1. Balkowiec A, Katz DM. Activity-dependent release of endogenous brain-derived neurotrophic factor from primary sensory neurons detected by ELISA in situ. Journal of Neuroscience. 2000;20:7417–7423. - PMC - PubMed
    1. Bevins RA, Besheer J. Object recognition in rats and mice: a one-trial non-matching-to-sample learning task to study ‘recognition memory’. Nature Protocols. 2006;1:1306–1311. - PubMed
    1. Buch T, Heppner FL, Tertilt C, Heinen TJAJ, Kremer M, Wunderlich FT, Jung S, Waisman A. A Cre-inducible diphtheria toxin receptor mediates cell lineage ablation after toxin administration. Nat Meth. 2005;2:419–426. - PubMed

Publication types