. 2013 Dec 18;80(6):1407-20.
doi: 10.1016/j.neuron.2013.10.006.

EphrinB3/EphA4-mediated guidance of ascending and descending spinal tracts

Affiliations

EphrinB3/EphA4-mediated guidance of ascending and descending spinal tracts

Sónia Paixão et al. Neuron. .

Abstract

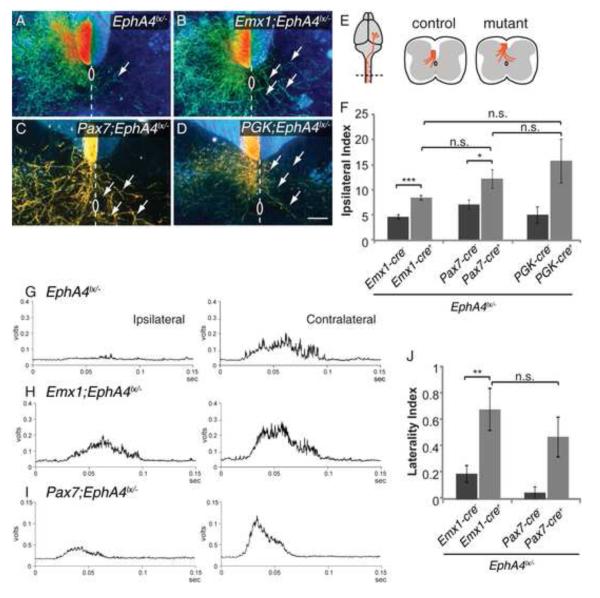
The spinal cord contains many descending and ascending longitudinal tracts whose development appears to be controlled by distinct guidance systems. We identified a population of dorsal spinal neurons marked by coexpression of the transcription factor Zic2 and the guidance receptor EphA4. Zic2+;EphA4+ neurons are surrounded by mechanosensory terminals, suggesting innervation by mechanoreceptor afferents. Their axons form an ipsilateral ascending pathway that develops during embryogenesis and projects within the ventral aspect of the dorsal funiculus, the same location as the descending corticospinal tract (CST), which develops postnatally. Interestingly, the same guidance mechanism, namely, ephrinB3-induced EphA4 forward signaling, is required for the guidance of both ascending and descending axon tracts. Our analysis of conditional EphA4 mutant mice also revealed that the development of the dorsal funiculus occurs independently of EphA4 expression in descending CST axons and is linked to the distribution of Zic2+;EphA4+ spinal neurons and the formation of the ascending pathway.


Figures

Figure 1
Figure 1. EphA4+ dorsal neurons express Zic2
(A,A’) Diagrams showing the location of the major ascending (left side) and descending spinal cord tracts (right side) running in the dorsal funiculus (df – dorsal funiculus, cc – central canal, drg – dorsal root ganglion, gr – gracile fasciculus, psdc – postsynaptic dorsal column pathway, cu – cuneate fasciculus, cst – dorsal corticospinal tract). (B-D) β-galactosidase expression from the EphA4βgeo-PLAP allele (in short EphA4PLAP) in mouse spinal cord transverse sections from the indicated embryonic stages. Dorsally located EphA4+ cells are indicated with arrows, and the forming dorsal funiculus, with a stippled line. High magnification image shows that EphA4+ cells border on the DF (D’). (E) βgal (EphA4, green) immunoreactivity close to the DF (dashed ellipses) colocalizes with Zic2 immunoreactivity (red, E,E’), whereas more centrally located Zic2+ cells (solid ellipses) are largely devoid of βgal (E”). (F) GFP immunoreactivity from the EphA4EGFP allele (green) co-localizes with Zic2+ cells (red) close to the DF (stippled circles) and not with the centrally located Zic2+ cells (smooth circles). Scale bars: 250μm (B-D), 50μm (E,F). See also Figure S1.
Figure 2
Figure 2. EphA4+/Zic2+ neurons send ascending projections into the dorsal funiculus
(A-C) PLAP expression to visualize EphA4+ axons from the EphA4PLAP allele in mouse spinal cord transverse sections from the indicated developmental stages. Note the PLAP+ axons (indicated with stippled lines) projecting as a bundle in the most ventral aspect of the DF (arrows). (D,E) GFP immunoreactivity of the Tg(EphA4-EGFP) mouse line (green) in transverse spinal cord sections from the indicated developmental stages and genotypes. The Tg(EphA4-EGFP) reporter line labels a large subset of EphA4+ neurons, co-stained with βgal (red) (D). Dorsal EphA4+ interneurons send their projections into the DF (arrows). (F) Corticospinal tract (CST) visualized in P2 cervical transverse spinal cord sections by the Emx1-Cre;tdTomato reporter. The CST bundle in post-natal stages occupies a similar position in the DF to the PLAP+ ascending bundle (arrows) formed during embryonic stages. Note the first pioneer axons exiting the bundle to innervate the spinal cord (arrowhead). (G) Scheme of the retrograde tracings on E18.5 spinal cords by injection of Rhodamine dextran (RD) in the DF at thoracic level. Ascending and descending projections correspond to labeled neurons caudal and rostral to the injection point, respectively. (H-K) Confocal images from a traced spinal cord after RD injection (red) and stained for Zic2 (green). Transverse sections correspond to the spinal cord levels indicated in (G). Arrows and arrowheads point to Zic2− neurons in rostral sections (H,I) and Zic2+ neurons in caudal sections (J,K) to the injection point, respectively. Examples indicated are shown in the insets at higher magnification. Dashed lines indicate DF and midline. (L) Quantification of dorsal RD-labeled Zic2+ neurons as a percentage of all dorsal RD-labeled neurons. Thick horizontal lines represents the mean; vertical error bars SEM, and dots represent individual values from each spinal cord (n=5 spinal cords; number of RD labeled neurons in caudal sections: 14-53, in rostral sections: 6-65 per spinal cord; *p=0.03, Mann–Whitney U-test). Scale bars: 250μm (A,B), 1mm (C), 50 μm (D-K). See also Figure S2.
Figure 3
Figure 3. EphA4 ablation from dorsal spinal cord causes midline misprojections
(A, A’) Overview of CINs tracings. (A) Scheme of the lumbar spinal cord illustrating the site of tracer application (black box), and the projections of labeled axons (in green). The position of transverse sections shown in B-D is indicated with black arrowheads. (A’) Schematic of a traced transverse spinal cord section showing ipsilateral INs (black) and CINs (green), the hypothetical trajectory of mutant axons is shown by green stippled lines. (B-D) Transverse spinal cord sections of the indicated genotypes after Rhodamine Green Dextran application (on the left). DF, central canal and midline are indicated by a white stippled line. The depth of the cut is indicated by a red stippled line. Panel B’ shows the size and positions of the areas that were used to quantify the abundance of labeled axons in dorsal and ventral aspects of the cord. Scale bars: 50μm. (E) Quantifications of the abundance of labeled axons in mutant (Cre+) versus control littermates (Cre) in dorsal versus ventral cord. Thick horizontal lines represents the mean; vertical error bars SEM, and dots represent individual values from each spinal cord (n=4 traced animals per genotype, 2-5 sections per embryo; *p=0.01, t-test). (F,G,J-M) Transverse spinal cord sections of the indicated genotypes and ages after PLAP staining. Note extensive midline crossing of PLAP+ axons just below the DF in dorsal cord-specific Lbx1-Cre;EphA4lx/PLAP and Pax7-Cre;EphA4lx/PLAP mice, as well as full knockouts (EphA4PLAP/−), but not in forebrain-specific Emx1-Cre;EphA4lx/PLAP mice. Axonal projections are highlighted with dashed lines. Scale bars: 100μm (F,G), 50μm (J-M). (H,I) Schematic drawings depicting axon paths in control and mutant cords. See also Figure S3.
Figure 4
Figure 4. EphA4 ablation affects positioning of dorsal interneurons
(A,B,D,E,H,I) E15.5 and (K,L) P0 transverse spinal cord sections (medio-dorsal part only) of the indicated genotypes stained for βgal (EphA4) and Zic2 to assess the spatial distribution of the cells. DF and midline are indicated by dashed lines. For E15.5 sections the entire image was used for quantification, for P0 the box in panel K indicates the region used for quantification. Scale bars: 50μm (A,B,D,E,H,I), 100μm (K,L). (A’,B’) Digital coordinates of βgal positive cells (x: medial-lateral axis, dorsal to central canal, x = 0 midline; y: medial-dorsal axis, dorsal to central canal, y = 0 central canal) for the represented images. (D’,E’,H’,I’,K’,L’) Digital coordinates of Zic2+ cells for the corresponding images. (C,F,G) Medio-lateral frequency distribution of dorsal βgal (C), Zic2 (F) and double positive (G) relative cell density in control (EphA4PLAP/+, black) and EphA4 KO mice (EphA4PLAP/−, red) represented as a non-linear regression (data were fitted as a sum of two Lorentizian distributions), raw data in Fig.S4 (n=3-4 embryos per genotype, 3-5 images per animal, p<0.0001 extra sum-of-squares F-test, comparing distributions center). Both cell populations shift towards the midline in the absence of EphA4. (J) Frequency distribution of central Zic2 cells. This small population does not change its position in the absence of EphA4 (n=3-4 animals per genotype, 2-4 sections per embryo, p>0.05 t-test). Data is sampled in too few bins to allow curve fitting. (M) Frequency distribution of dorsal Zic2 cells represented as in (F) in Lbx1-Cre;EphA4lx/PLAP mice, showing a similar behavior of dorsal Zic2+ cells as in the full KO (n=3 animals per genotype, 3 sections per embryo, p<0.0001 sum of squares F-test, comparing distributions center). (N-Q) Double in situ hybridization (ISH) for LacZ (purple) and ephrinB3 (brown) in spinal cord cross sections of the indicated genotypes and developmental stages. Note that in EphA4 mutants, LacZ positive cells surrounding the DF (dashed line), shift to the midline in a gap of ephrinB3 expression (bracket). Scale bars: 250μm. (R,S) ISH for Gdf10 midline marker, in newborn spinal cord cross sections of the indicated genotypes. The extended gray matter, usually occupied by the DF (bracket), is devoid of the midline marker in EphA4 KO mice. Scale bar: 200μm. (T-V) Growth cone collapse (GCC) assay from E14.5+2DIV cultured dissociated dorsal SC Tg(Zic2-EGFP) neurons. (T,U) Representative examples of scored growth cones in phalloidin-stained (red) Zic2+ cultured neurons (green) treated with pre-clustered control Fc (T) or ephrinB3-Fc (U). Nuclei were stained with DAPI (blue). Note the reduced actin staining and lack of filopodial extensions at the tip of the collapsed growth cone. (V) Histogram showing the mean ± s.e.m. percentage of GCC in Fc- and ephrinB3- treated cultures (n=3 cultures, >100 neurons scored per condition for each experiment, *p=0.04, t-test). Scale bar: 10μm. See also Figure S4.
Figure 5
Figure 5. EphrinB3/EphA4 forward signaling is required for ascending projection
(A,B,D,E) Zic2 immunostainings (red) on spinal cord transverse sections of the indicated genotypes and developmental stages, counterstained with the nuclear fluorescent dye To-Pro-3 (blue). The midline shift of Zic2+ cells is dependent on EphA4-forward signaling and ephrinB3 ligand. Box in A and line in D, indicate the regions considered for the digital coordinates. Scale bars: 100μm (A,B), 50μm (D,E). (A’,B’,D’,E’) Digital coordinates of Zic2+ cells for the corresponding images. (C,F) Medio-lateral distribution of Zic2 relative cell density in ephrinB3 KO (C) and EphA4 signaling-deficient mutants (EphA4EGFP allele) (F) represented as a non-linear regression (data were fitted as a sum of two Lorentizian distributions), raw data in Fig. S4 (n=3 embryos per genotype, 3 images per animal, p<0.0001 extra sum-of-squares F-test, comparing distributions center). (G-J) PLAP staining to visualize EphA4+ axons in spinal cord transverse sections from the indicated genotypes. Note the aberrant midline crossings of EphA4+ axons in ephrinB3 KOs (H) and signaling-deficient EphA4EGFP (J) mutants compared to controls (G,I), indicated by dashed lines. Scale bars: 100μm (G,H), 50μm (I,J). See also Figure S4.
Figure 6
Figure 6. Dorsal funiculus development requires EphA4 in spinal cord
(A-E) Dark field photographs of adult spinal cord transverse sections at lumbar levels from the indicated genotypes. Note that the DF is much reduced in spinal cord-specific EphA4 mutants, Pax7-Cre;EphA4lx/− (C) and Lbx1-Cre;EphA4 lx/− (D), compared to controls and forebrain-specific EphA4 mutant, Emx1-Cre;EphA4 lx/− (B), similar to the full KO situation, PGK-Cre;EphA4lx/− (E). In controls, the ventral tip of the DF (arrows) reaches the central canal, whereas in the affected mutants, the ventral tip of the DF is far away from the central canal (brackets). Scale bars: 500μm. (F) Schematic representation of the quantification of DF dorso-ventral extensions. The lengths of A and B are measured and the ratio of A/B is calculated. (G) Comparison of A/B ratios between the indicated EphA4 mutant mice represented as mean ± s.e.m. (n=3-6 animals per genotype, n=2 for PGK-Cre control, 6-19 sections per animal, ***p<0.001, t-test). (H,I) Immunostainings on newborn spinal cord cross-sections from the indicated genotypes for CGRP (red), parvalbumin (Pv) (green) and TrkB (blue). The pattern of the major tracts running in the DF, gracile (gr), cuneate (cu) fasciculi and the future corticospinal tract (cst) does not seem to be altered. See also Figure S5.
Figure 7
Figure 7. Descending corticospinal axons require EphA4 in both a cell and non-cell autonomous way
(A-D) Dark field photographs of adult spinal cord cross-sections at the brachial level 10 days post-biotin dextran (BDA) injections, showing aberrant midline crossing (ipsilateral) axons (arrows) in EphA4 forebrain-specific (Emx1-Cre;EphA4lx/−) (B) and spinal cord-specific (Pax7-Cre;EphA4lx/−) (C) mutant mice, comparable to full knockouts (PGK-Cre;EphA4lx/−) (D), but not controls (A), indicating that EphA4 is required both in CST axons (cell autonomous) and in dorsal spinal cord (non-cell autonomous) for correct CST pathfinding. Dashed lines represent midline, white circles represent central canal. Scale bar: 50μm. (E) Schematic of CST tracings depicting the site of BDA injection into the motor cortex and the paths of labeled axons (in orange). The position of the sections shown in A-D is indicated with a stippled line. On the right, schematic depicting axon paths in control and mutant cords. (F) Quantification of CST axon midline recrossing measured as ipsilateral index (ratio of numbers of crossed pixels and total pixels) represented as mean ± s.e.m. (n=5 or 6 animals per genotype, n=2 for PGK-Cre control, 6-14 sections per animal, *p<0.05,***p<0.001, t-test). (G-I) Bilateral-evoked EMG responses in EphA4 forebrain and spinal cord knockout mice (Emx1-Cre;EphA4lx/−, Pax7-Cre;EphA4lx/−). Histograms are averages of responses across all animals in each group. Averaged responses are synchronized with the onset of the stimulus (total of 20 stimulation sites in 6 hemispheres, n=4 mice for Emx1-Cre;EphA4lx/−; 37 sites, 10 hemispheres, n=6 mice for Emx1-Cre controls; 49 sites, 10 hemispheres, n=5 mice, for Pax7-Cre;EphA4lx/− ; and 3 hemispheres, n=2 mice, for Pax7-Cre controls). The thresholds for evoking contralateral responses were not different in the two groups (Emx1-Cre;EphA4lx/−: 25.00 ± 1.213; EphA4lx/−: 22.58 ± 0.8147; n.s., p=0.08). Emx1 Calibration: 0.1 volts. Pax7 Calibration: 0.05. The reasons for the weaker responses in the Pax7-Cre;EphA4lx/− mice was that different preamplifiers and amplifiers were used compared to the other cohorts. (J) Laterality index (integrated ipsilateral / integrated contralateral EMG value) for EphA4 mutant mice represented as mean ± s.e.m.. The index was 3.6 times larger in the forebrain KOs (Emx1-Cre;EphA4lx/−) than control (EphA4lx/−) mice (0.68±0.16 v/s 0.19±0.06; p=0.006) confirming bilateral motor responses. The laterality index for the EphA4 forebrain and spinal cord mutant mice were not different (Emx1-Cre;EphA4lx/−: 0.68±0.16; Pax7-Cre;EphA4lx/−: 0.48±0.15; unpaired t-test; n.s., p=0.38).
Figure 8
Figure 8. Zic2+ dorsal neurons receive mechanosensory input
(A,B) Co-immunostaining of Zic2 (blue), VGluT1 (green), and the proprioceptive marker Parvalbumin (Pv, red) in newborn spinal cord transverse sections of the indicated genotypes. Yellow dashed circles indicate the lateral regions containing proprioceptive (Pv+) terminals that colocalize with VGluT1. Zic2+ cells are in two separate populations: a dorsal VGluT1+ population (white dashed circles) and a more ventral VGluT1- population (arrow). Neither of the two populations receives significant proprioceptive input. In EphA4 spinal cord-specific Lbx1-Cre;EphA4lx/PLAP mutants (B), Zic2+ cells move towards the midline (single white dashed circle) and maintain VGluT1 sensory afferent innervations. (B’) Higher magnification image of the VGLuT1+;Zic2+ cells that move to the midline (stippled line) in (B). (C,D) VGluT1 immunostaining (red) in newborn transverse spinal cord sections of Tg(Zic2-EGFP) mice. High-magnification image (D) shows VGluT1 puncta (red) on Zic2+ (green) cell bodies and processes. (E) VGluT1 (red) and GFP (green) immunostaining in newborn transverse spinal cord sections of Tg(EphA4-EGFP) mice showing synaptic VGluT1 puncta on EphA4+ processes. (F,G) Rapidly adapting (RA) mechanoreceptor afferents visualized in transverse spinal cord sections by the reporter line td-Tomato crossed with Ret-CreERT2 (red). Co-immunostaining with Zic2 (blue) and VGluT1 (green) shows that the dorsal population of Zic2 neurons are surrounded by VGluT1+, Ret+ mechanosensory terminals. Scale bars: 100μm (A-C,F), 25μm (B’), 5μm (D,E,G). See also Figure S6.

Similar articles

Cited by

References

    1. Asante CO, Chu A, Fisher M, Benson L, Beg A, Scheiffele P, Martin J. Cortical control of adaptive locomotion in wild-type mice and mutant mice lacking the ephrin-Eph effector protein alpha2-chimaerin. J Neurophysiol. 2010;104:3189–3202. - PMC - PubMed
    1. Bink K, Walch A, Feuchtinger A, Eisenmann H, Hutzler P, Höfler H, Werner M. TO-PRO-3 is an optimal fluorescent dye for nuclear counterstaining in dual-colour FISH on paraffin sections. Histochem Cell Biol. 2001;115:293–299. - PubMed
    1. Butt SJ, Lundfald L, Kiehn O. EphA4 defines a class of excitatory locomotorrelated interneurons. Proc Natl Acad Sci U S A. 2005;102:14098–14103. - PMC - PubMed
    1. Coonan JR, Greferath U, Messenger J, Hartley L, Murphy M, Boyd AW, Dottori M, Galea MP, Bartlett PF. Development and reorganization of corticospinal projections in EphA4 deficient mice. J Comp Neurol. 2001;436:248–262. - PubMed
    1. Dottori M, Hartley L, Galea M, Paxinos G, Polizzotto M, Kilpatrick T, Bartlett PF, Murphy M, Köntgen F, Boyd AW. EphA4 (Sek1) receptor tyrosine kinase is required for the development of the corticospinal tract. Proceedings of the National Academy of Sciences of the United States of America. 1998;95:13248–13253. - PMC - PubMed

Publication types

MeSH terms

LinkOut - more resources