

A simulative comparison of respondent driven sampling with incentivized snowball sampling--the "strudel effect"
- PMID: 24360650
- PMCID: PMC3941002
- DOI: 10.1016/j.drugalcdep.2013.11.020
A simulative comparison of respondent driven sampling with incentivized snowball sampling--the "strudel effect"
Abstract
Background: Respondent driven sampling (RDS) and incentivized snowball sampling (ISS) are two sampling methods that are commonly used to reach people who inject drugs (PWID).
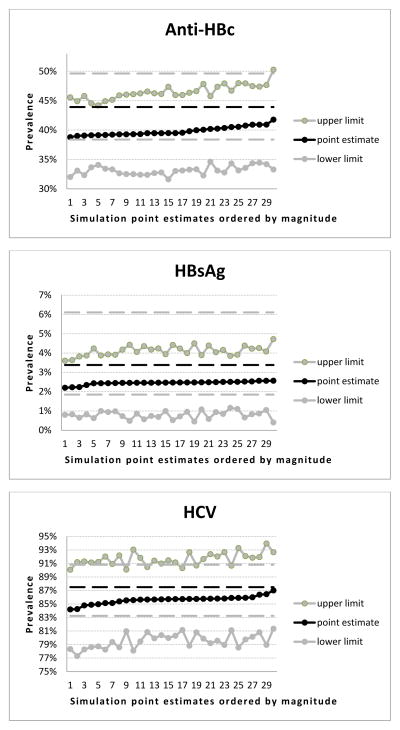
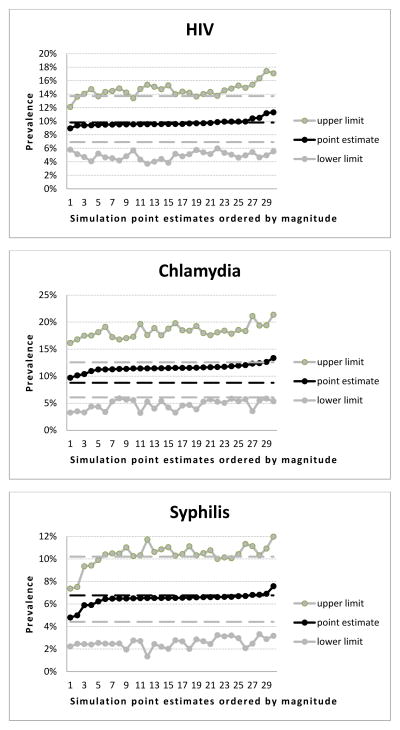
Methods: We generated a set of simulated RDS samples on an actual sociometric ISS sample of PWID in Vilnius, Lithuania ("original sample") to assess if the simulated RDS estimates were statistically significantly different from the original ISS sample prevalences for HIV (9.8%), Hepatitis A (43.6%), Hepatitis B (Anti-HBc 43.9% and HBsAg 3.4%), Hepatitis C (87.5%), syphilis (6.8%) and Chlamydia (8.8%) infections and for selected behavioral risk characteristics.
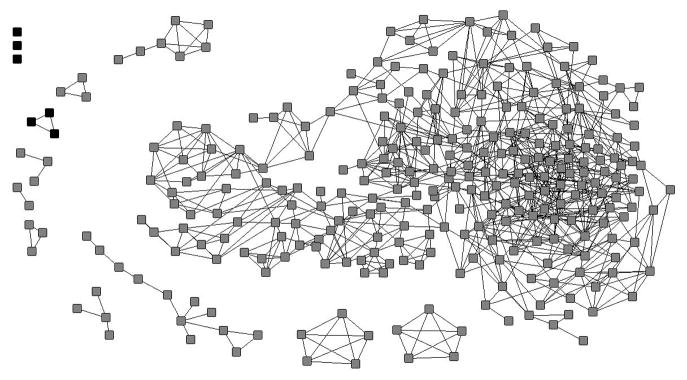
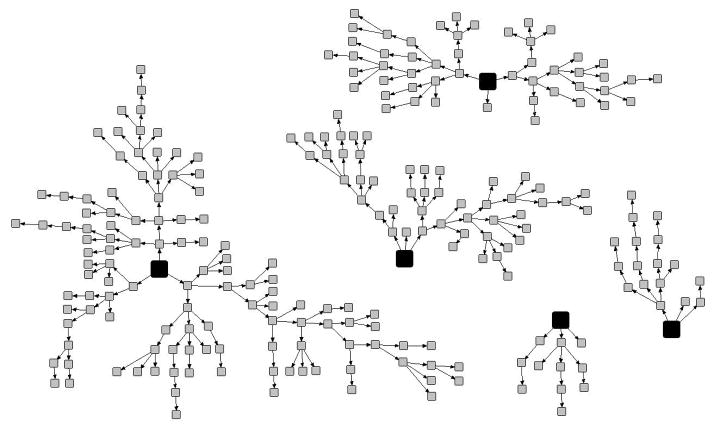
Results: The original sample consisted of a large component of 249 people (83% of the sample) and 13 smaller components with 1-12 individuals. Generally, as long as all seeds were recruited from the large component of the original sample, the simulation samples simply recreated the large component. There were no significant differences between the large component and the entire original sample for the characteristics of interest. Altogether 99.2% of 360 simulation sample point estimates were within the confidence interval of the original prevalence values for the characteristics of interest.
Conclusions: When population characteristics are reflected in large network components that dominate the population, RDS and ISS may produce samples that have statistically non-different prevalence values, even though some isolated network components may be under-sampled and/or statistically significantly different from the main groups. This so-called "strudel effect" is discussed in the paper.
Keywords: Incentivized snowball sampling; People who inject drugs; Prevalence estimates; Respondent driven sampling; Sampling methodology; Simulations.
Copyright © 2013 Elsevier Ireland Ltd. All rights reserved.
Figures
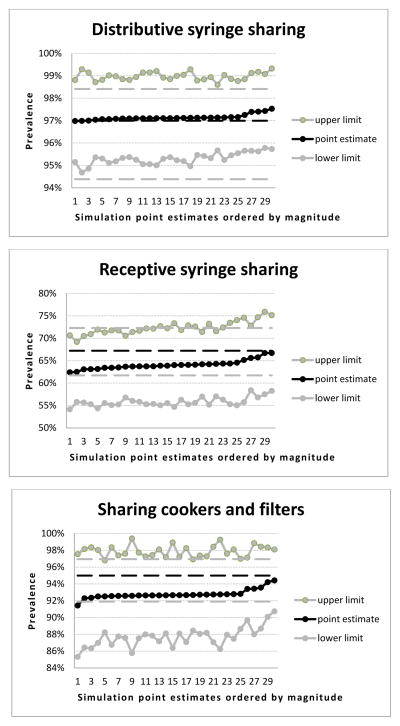
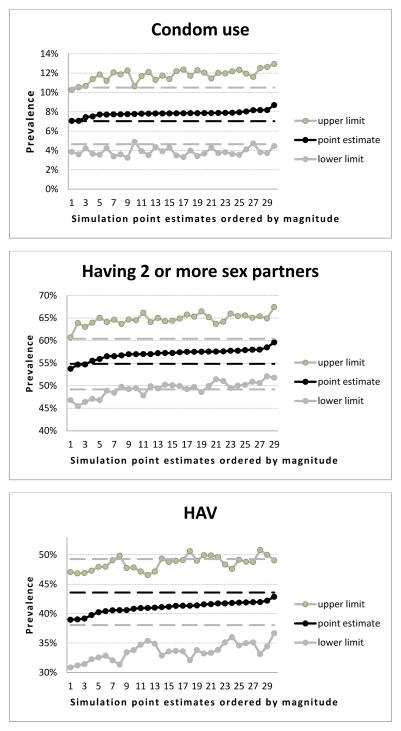
For better visualization and interpretation, point estimates of the simulation samples were ordered by magnitude (the X axis of each chart represents the rank order of the simulation sample point estimates), and only the related confidence interval ranges are depicted (therefore the Y axis ranges are different for each chart both in terms of minimum and maximum values and in terms of units within the ranges between minimum and maximum).
Prevalence and, respectively, 95% confidence intervals for each characteristic in the original sample are represented as black and, respectively, gray vertical lines within each chart to provide a visual reference for the point estimates of the simulation samples.
Statistically significant difference is when a point estimate of the simulation sample lies either under the lower confidence interval or above the upper confidence interval of the prevalence within the original sample for the relevant characteristic.
References
-
- Borgatti SP, Everett MG, Freeman LC. Ucinet for Windows: Software for Social Network Analysis. Analytic Technologies; Harvard, MA: 2002.
-
- Friedman SR, Curtis R, Neaigus A, Jose B, Des Jarlais DC. Social Networks, Drug Injectors’ Lives, and HIV. Plenum; New York: 1999.
Publication types
MeSH terms
Grants and funding
LinkOut - more resources
Full Text Sources
Other Literature Sources
