Homonuclear decoupling for enhancing resolution and sensitivity in NOE and RDC measurements of peptides and proteins
- PMID: 24360766
- PMCID: PMC3965638
- DOI: 10.1016/j.jmr.2013.11.006
Homonuclear decoupling for enhancing resolution and sensitivity in NOE and RDC measurements of peptides and proteins
Abstract
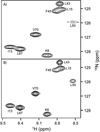
Application of band-selective homonuclear (BASH) (1)H decoupling pulses during acquisition of the (1)H free induction decay is shown to be an efficient procedure for removal of scalar and residual dipolar couplings between amide and aliphatic protons. BASH decoupling can be applied in both dimensions of a homonuclear 2D NMR experiment and is particularly useful for enhancing spectral resolution in the H(N)-H(α) region of NOESY spectra of peptides and proteins, which contain important information on the backbone torsion angles. The method then also prevents generation of zero quantum and Hz(N)-Hz(α) terms, thereby facilitating analysis of intraresidue interactions. Application to the NOESY spectrum of a hexapeptide fragment of the intrinsically disordered protein α-synuclein highlights the considerable diffusion anisotropy present in linear peptides. Removal of residual dipolar couplings between H(N) and aliphatic protons in weakly aligned proteins increases resolution in the (1)H-(15)N HSQC region of the spectrum and allows measurement of RDCs in samples that are relatively strongly aligned. The approach is demonstrated for measurement of RDCs in protonated (15)N/(13)C-enriched ubiquitin, aligned in Pf1, yielding improved fitting to the ubiquitin structure.
Keywords: Diffusion anisotropy; IDP; Liquid crystal; NOESY; RDC; Residual dipolar coupling; Synuclein; Ubiquitin; Weak alignment.
Published by Elsevier Inc.
Figures


Similar articles
-
Improved detection of long-range residual dipolar couplings in weakly aligned samples by Lee-Goldburg decoupling of homonuclear dipolar truncation.J Biomol NMR. 2004 Dec;30(4):443-50. doi: 10.1007/s10858-004-5318-0. J Biomol NMR. 2004. PMID: 15630564
-
Determination of residual dipolar couplings in homonuclear MOCCA-SIAM experiments.J Biomol NMR. 2002 Jul;23(3):211-9. doi: 10.1023/a:1019841602348. J Biomol NMR. 2002. PMID: 12238593
-
Very large residual dipolar couplings from deuterated ubiquitin.J Biomol NMR. 2012 Sep;54(1):53-67. doi: 10.1007/s10858-012-9651-4. Epub 2012 Jul 25. J Biomol NMR. 2012. PMID: 22828737
-
Weak alignment NMR: a hawk-eyed view of biomolecular structure.Curr Opin Struct Biol. 2005 Oct;15(5):563-70. doi: 10.1016/j.sbi.2005.08.006. Curr Opin Struct Biol. 2005. PMID: 16140525 Review.
-
Homonuclear dipolar recoupling techniques for structure determination in uniformly 13C-labeled proteins.Solid State Nucl Magn Reson. 2009 Nov;36(3):119-28. doi: 10.1016/j.ssnmr.2009.07.003. Epub 2009 Aug 5. Solid State Nucl Magn Reson. 2009. PMID: 19729285 Review.
Cited by
-
Solvent Suppression in Pure Shift NMR.Anal Chem. 2024 Mar 5;96(9):3879-3885. doi: 10.1021/acs.analchem.3c05379. Epub 2024 Feb 21. Anal Chem. 2024. PMID: 38380610 Free PMC article.
-
Pure shift amide detection in conventional and TROSY-type experiments of 13C,15N-labeled proteins.J Biomol NMR. 2022 Dec;76(5-6):213-221. doi: 10.1007/s10858-022-00406-z. Epub 2022 Nov 18. J Biomol NMR. 2022. PMID: 36399207 Free PMC article.
-
Precise measurement of long-range heteronuclear coupling constants by a novel broadband proton-proton-decoupled CPMG-HSQMBC method.Chemistry. 2015 Feb 16;21(8):3472-9. doi: 10.1002/chem.201405535. Epub 2015 Jan 8. Chemistry. 2015. PMID: 25573660 Free PMC article.
-
Easy and unambiguous sequential assignments of intrinsically disordered proteins by correlating the backbone 15N or 13C' chemical shifts of multiple contiguous residues in highly resolved 3D spectra.J Biomol NMR. 2015 Feb;61(2):109-21. doi: 10.1007/s10858-014-9890-7. Epub 2015 Jan 11. J Biomol NMR. 2015. PMID: 25577242
-
Visualizing unresolved scalar couplings by real-time J-upscaled NMR.J Am Chem Soc. 2015 Apr 22;137(15):5163-9. doi: 10.1021/jacs.5b01687. Epub 2015 Apr 13. J Am Chem Soc. 2015. PMID: 25837306 Free PMC article.
References
-
- Bax A, Freeman R. Investigation of Complex Networks of Spin-Spin Coupling By Two- Dimensional NMR. J. Magn. Reson. 1981;44:542–561.
-
- van de Ven FJM, Philippens MEP. Optimization of constant-time evolution in multidimensional NMR experiments. J. Magn. Reson. 1992;97:637–644.
-
- Vuister GW, Bax A. Resolution enhancement and spectral editing of uniformly13C-enriched proteins by homonuclear broadband13C decoupling. J. Magn. Reson. 1992;98:428–435.
-
- Bax A. Broad-band homonuclear decoupling in heteronuclear shift correlation NMR spectroscopy. J. Magn. Reson. 1983;53:517–520.
-
- Zangger K, Sterk H. Homonuclear broadband-decoupled NMR spectra. J. Magn. Reson. 1997;124:486–489.
Publication types
MeSH terms
Substances
Grants and funding
LinkOut - more resources
Full Text Sources
Other Literature Sources

