. 2014 Jan 2;94(1):11-22.
doi: 10.1016/j.ajhg.2013.11.008. Epub 2013 Dec 19.

Exome sequence reveals mutations in CoA synthase as a cause of neurodegeneration with brain iron accumulation

Affiliations

Exome sequence reveals mutations in CoA synthase as a cause of neurodegeneration with brain iron accumulation

Sabrina Dusi et al. Am J Hum Genet. .

Abstract

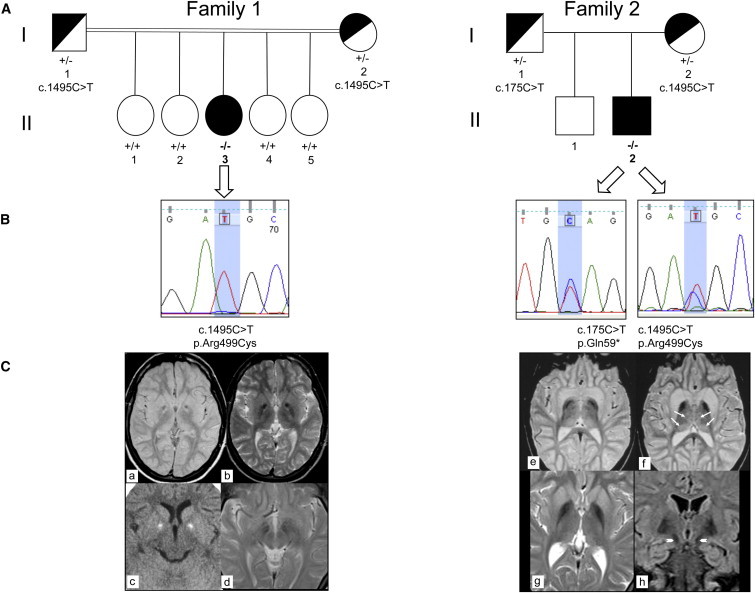
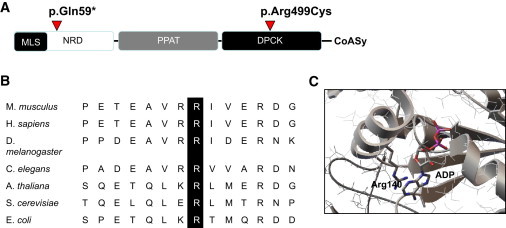
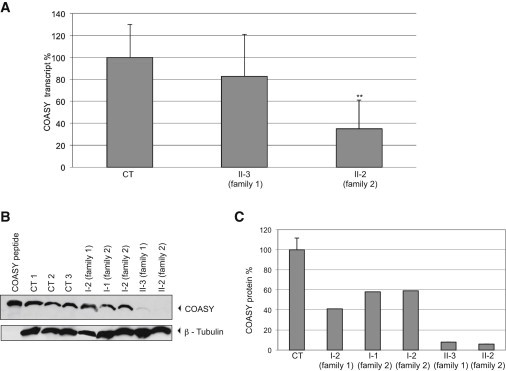
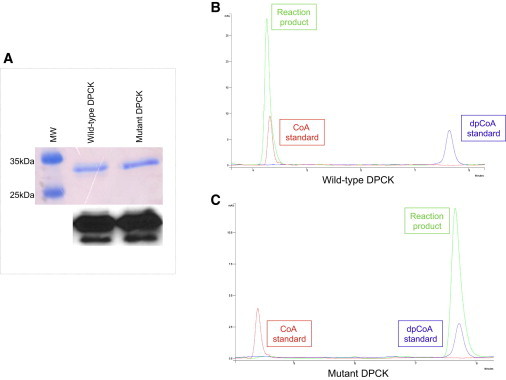
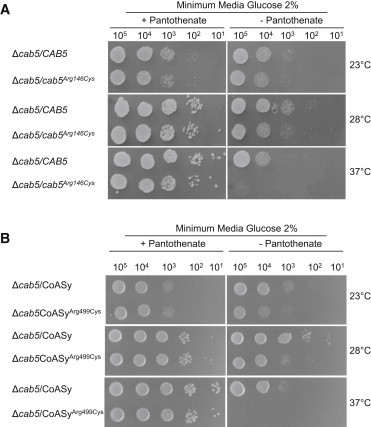
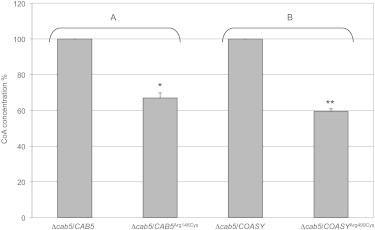
Neurodegeneration with brain iron accumulation (NBIA) comprises a clinically and genetically heterogeneous group of disorders with progressive extrapyramidal signs and neurological deterioration, characterized by iron accumulation in the basal ganglia. Exome sequencing revealed the presence of recessive missense mutations in COASY, encoding coenzyme A (CoA) synthase in one NBIA-affected subject. A second unrelated individual carrying mutations in COASY was identified by Sanger sequence analysis. CoA synthase is a bifunctional enzyme catalyzing the final steps of CoA biosynthesis by coupling phosphopantetheine with ATP to form dephospho-CoA and its subsequent phosphorylation to generate CoA. We demonstrate alterations in RNA and protein expression levels of CoA synthase, as well as CoA amount, in fibroblasts derived from the two clinical cases and in yeast. This is the second inborn error of coenzyme A biosynthesis to be implicated in NBIA.


Figures

Figure 1
Figure 1
Genetics and MRI of Subjects Carrying COASY Mutations (A) Pedigrees of family 1 (left) and family 2 (right). II-3, affected individual in family 1; II-2, affected individual in family 2. The presence of homozygous or compound heterozygous mutation is indicated by −/−; wild-type sequence by +/+; heterozygous mutation by +/−. (B) Electropherograms show sequence variations in individual II-3 of family 1 (left) and in individual II-2 of family 2 (right). (C) Left: MRI of individual II-3 of family 1 at 11 years of age (a–c). Axial MR (1.5 T) proton density and T2-weighted images (a, b) show bilateral low signal intensity in the globi pallidi (clearly visible in b) with a central region of high signal intensity located in the antero-medial portion of the nuclei (“eye-of-the-tiger” sign) and with a large central spot of low signal intensity. Axial CT (c) shows bilateral hyperdensities consistent with calcifications and corresponding to the central spot visible on MRI. Six years later (d), no changes were found. The hypointensity in the medial portion of the substantia nigra was also unchanged. Right: MRI of individual II-2 of family 2 at 9 years of age (e, f) and at age 19 (g, h). Axial T2-weighted 1.5 T MR images (e, f) reveal hypointensity in the pallida. Both caudate nuclei and putamina are swollen and hyperintense. Slight hyperintensity is also present in both medial and posterior thalami (arrows). Axial T2-weighted MR image (g) confirms bilateral symmetric low signal intensity and atrophy in the pallida. Both putamina and caudate nuclei are still slightly hyperintense with minimal swelling. Coronal FLAIR image (h) demonstrates low signal in both pallida and in the medial portion of the substantia nigra (arrowheads).
Figure 2
Figure 2
COASY: Conserved Domains, Phylogenetic Conservation, and Crystal Structure (A) Schematic domain organization of human CoA synthase and location of point mutations. Abbreviations are as follows: MLS, mitochondrial localization signal; NRD, N terminus regulatory domain; PPAT, 4′PP adenylyltransferase domain; DPCK, dephospho-CoA kinase domain. (B) Amino acid sequence alignment showing conservation of Arg499 across species. (C) Crystal structure of E. coli DPCK (CoaE) (PDB ID 1VHL) showing the position of Arg140 (equivalent to Arg499 in human DPCK) in the nucleotide-binding site.
Figure 3
Figure 3
COASY mRNA Expression and Protein Accumulation in Skin Fibroblasts (A) Quantification of COASY mRNA levels by real-time PCR in fibroblasts of subject II-3 and II-2 relative to the expression of glyceraldehyde 3-phosphate dehydrogenase (GAPDH). The amount of COASY transcript is reduced in subject II-2 versus control samples (CT), indicating mRNA decay. Data are represented as mean ± SD. Statistically significant differences with CT were determined by the Student’s t test; ∗∗p < 0.02. (B) Immunoblot analysis of COASY in fibroblasts derived from three healthy subjects (CT 1, CT 2, CT 3), individual I-2 (family 1), individuals I-1 and I-2 (family 2), and affected subjects (II-3 and II-2). The same amount of protein (30 μg) was loaded. β-tubulin was used as a loading control. As a control, COASY in vitro translation product (COASY peptide) was loaded. (C) Relative quantification of the protein amount: mean ± SD of three controls (CT); of individual I-2 (family 1); of individuals I-1 and I-2 (family 2); and of affected subjects II-3 and II-2. Histogram shows COASY amount quantified by densitometry and normalized on β-tubulin level.
Figure 4
Figure 4
Mitochondrial Localization of COASY (A) Immunoblot analysis on mitochondria and different submitochondrial fractions derived from HeLa cells. Mitochondria were treated for 15 min at 4°C or 37°C with proteinase K (PK) in presence or absence of triton. The filter was incubated with anti-COASY, anti-CORE1, anti-ETHE1, and anti-VDAC1 antibodies. As a control, COASY in vitro translation product (COASY peptide) was loaded. (B) Immunoblot analysis on mitoplasts, matrix, and inner membrane isolated from HeLa cells. Mitoplasts were treated for 15 min at 4°C or 37°C with PK in presence or absence of triton. The filter was sequentially incubated with anti-COASY, anti-ETHE1, anti-CORE1, and anti-VDAC antibodies.
Figure 5
Figure 5
HPLC Analysis of CoA Production by Wild-Type and Mutant DPCK Recombinant Proteins (A) Top: equal amount of purified wild-type and mutant DPCK proteins were loaded on a 12% SDS page and stained with Coomassie blue. Bottom: immunoblot analysis on the same gel showing that anti-COASY antibody is able to recognize both the wild-type and the mutant protein. (B) Chromatogram showing the peak corresponding to the reaction product (green) obtained from incubation of wild-type DPCK recombinant protein with ATP and dephospho-CoA. (C) Chromatogram showing the peak corresponding to the reaction product (green) obtained from incubation of mutant DPCK-Arg499Cys recombinant protein with ATP and dephospho-CoA. Red peak, CoA standard; blue peak, dephospho-CoA standard.
Figure 6
Figure 6
HPLC Analysis of CoA and CoA Derivatives in Fibroblasts (A) CoA (white bar), acetyl-CoA (black bar), and total CoA (gray bar) levels in primary skin fibroblasts derived from a healthy control (CT) and from the two affected individuals (II-3, family 1; II-2, family 2). Results shown are mean ± SEM of four independent experiments. Statistically significant differences in acetyl-CoA amount between CT and subject II-3 (family 1) were determined by the Student’s t test; p < 0.05. This subject also shows a reduction in acetyl-CoA, which is not statistically significant. A reduction of total CoA was observed in both affected individuals, although not statistically significant. (B) De novo synthesis of CoA and dephosphoCoA (dpCoA) in primary skin fibroblasts derived from a healthy control (CT) and from the two affected individuals (II-3, family 1; II-2, family 2). CoA (white bar) and dpCoA (gray bar) produced from 4′PP as substrate were quantified by HPLC after deproteinization of reaction mixture with PCA (3% final). Results shown are mean ± SEM of values from three independent experiments. Statistically significant differences with CT were determined by the Student’s t test; ∗∗p < 0.02.
Figure 7
Figure 7
Growth of Yeast Strains in Presence or Absence of Pantothenate The strain Δcab5 was transformed with pFL39 plasmid carrying the wild-type CAB5 and the mutant allele cab5Arg146Cys (A) or with pYEX-BX plasmid carrying COASY and COASYArg499Cys (B). Equal amounts of serial dilutions of cells from exponentially grown cultures (105, 104, 103, 102, 101 cells) were spotted onto minimum medium 40 plus 2% glucose, with or without pantothenate 1 mg l−1. The growth was scored after 3 days of incubation at 23°C, 28°C, or 37°C. Each experiment of serial dilution grow test was done in triplicate starting from independent yeast cultures.
Figure 8
Figure 8
HPLC Analysis of CoA in Yeast Mitochondria CoA level in mitochondria isolated from Δcab5 yeast transformed with wild-type (WT) or mutant (p.Arg146Cys) yeast CAB5 (A), and with wild-type or mutant (p.Arg499Cys) human COASY (B). Equal amount of mitochondrial proteins (40 μg) were used in each assay. Results shown are mean ± SD of values from three independent experiments. Values of mutant samples are expressed as percentage of values obtained in wild-type samples taken as 100%. Statistically significant differences were determined by the Student’s t test; p < 0.05; ∗∗p < 0.02.

References

    1. Gregory A., Hayflick S.J. Genetics of neurodegeneration with brain iron accumulation. Curr. Neurol. Neurosci. Rep. 2011;11:254–261. - PMC - PubMed
    1. Zhou B., Westaway S.K., Levinson B., Johnson M.A., Gitschier J., Hayflick S.J. A novel pantothenate kinase gene (PANK2) is defective in Hallervorden-Spatz syndrome. Nat. Genet. 2001;28:345–349. - PubMed
    1. Hörtnagel K., Prokisch H., Meitinger T. An isoform of hPANK2, deficient in pantothenate kinase-associated neurodegeneration, localizes to mitochondria. Hum. Mol. Genet. 2003;12:321–327. - PubMed
    1. Morgan N.V., Westaway S.K., Morton J.E., Gregory A., Gissen P., Sonek S., Cangul H., Coryell J., Canham N., Nardocci N. PLA2G6, encoding a phospholipase A2, is mutated in neurodegenerative disorders with high brain iron. Nat. Genet. 2006;38:752–754. - PMC - PubMed
    1. Kruer M.C., Paisán-Ruiz C., Boddaert N., Yoon M.Y., Hama H., Gregory A., Malandrini A., Woltjer R.L., Munnich A., Gobin S. Defective FA2H leads to a novel form of neurodegeneration with brain iron accumulation (NBIA) Ann. Neurol. 2010;68:611–618. - PMC - PubMed

Publication types

MeSH terms