. 2013 Dec 26;5(6):1489-98.
doi: 10.1016/j.celrep.2013.11.041. Epub 2013 Dec 19.

Human natural killer cells prevent infectious mononucleosis features by targeting lytic Epstein-Barr virus infection

Affiliations

Human natural killer cells prevent infectious mononucleosis features by targeting lytic Epstein-Barr virus infection

Obinna Chijioke et al. Cell Rep. .

Erratum in

  • Cell Rep. 2015 Aug 4;12(5):901

Abstract

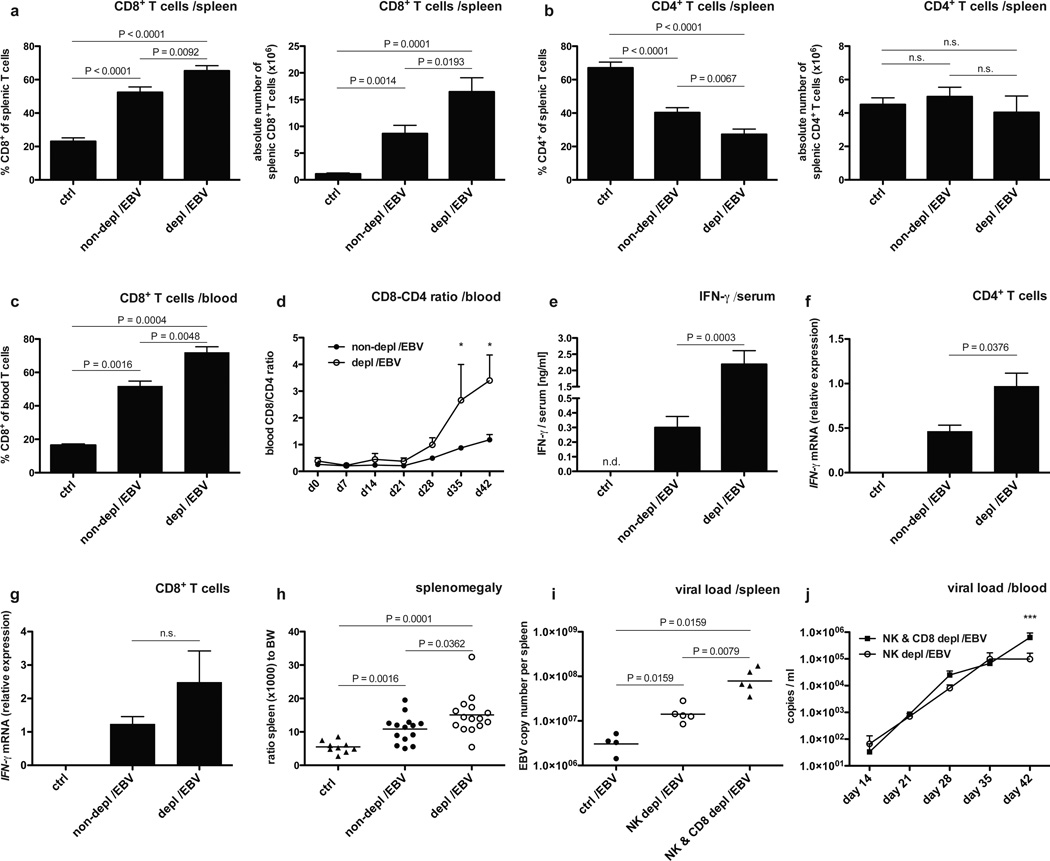
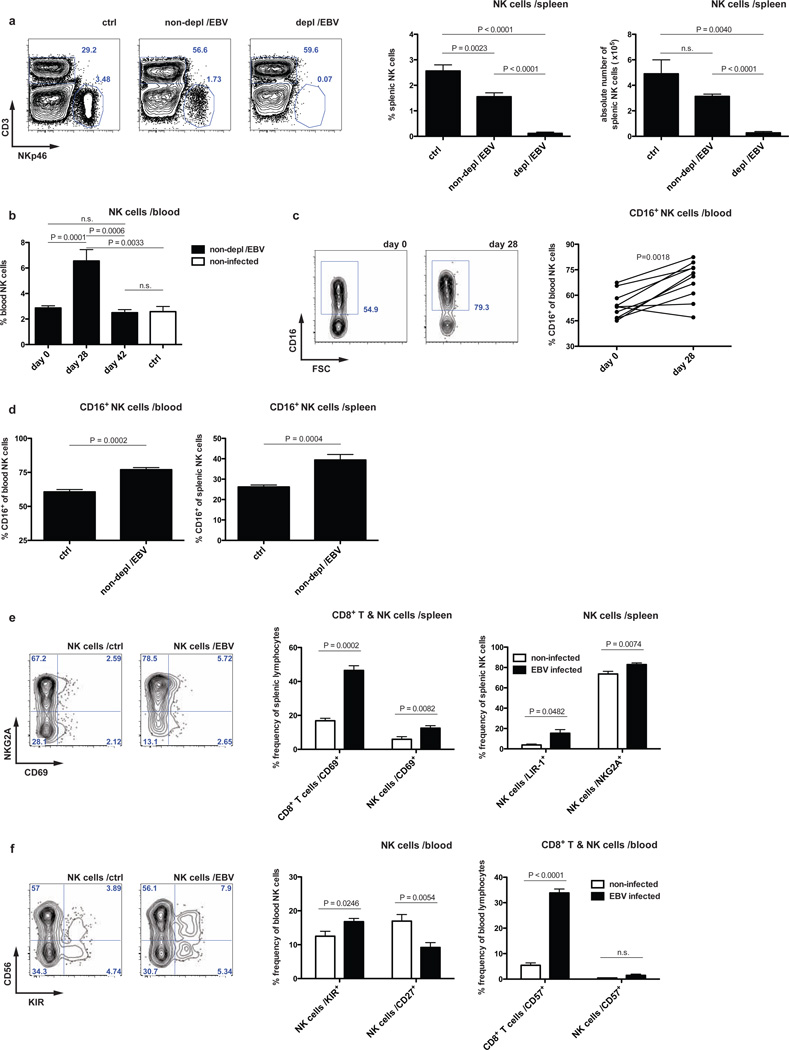
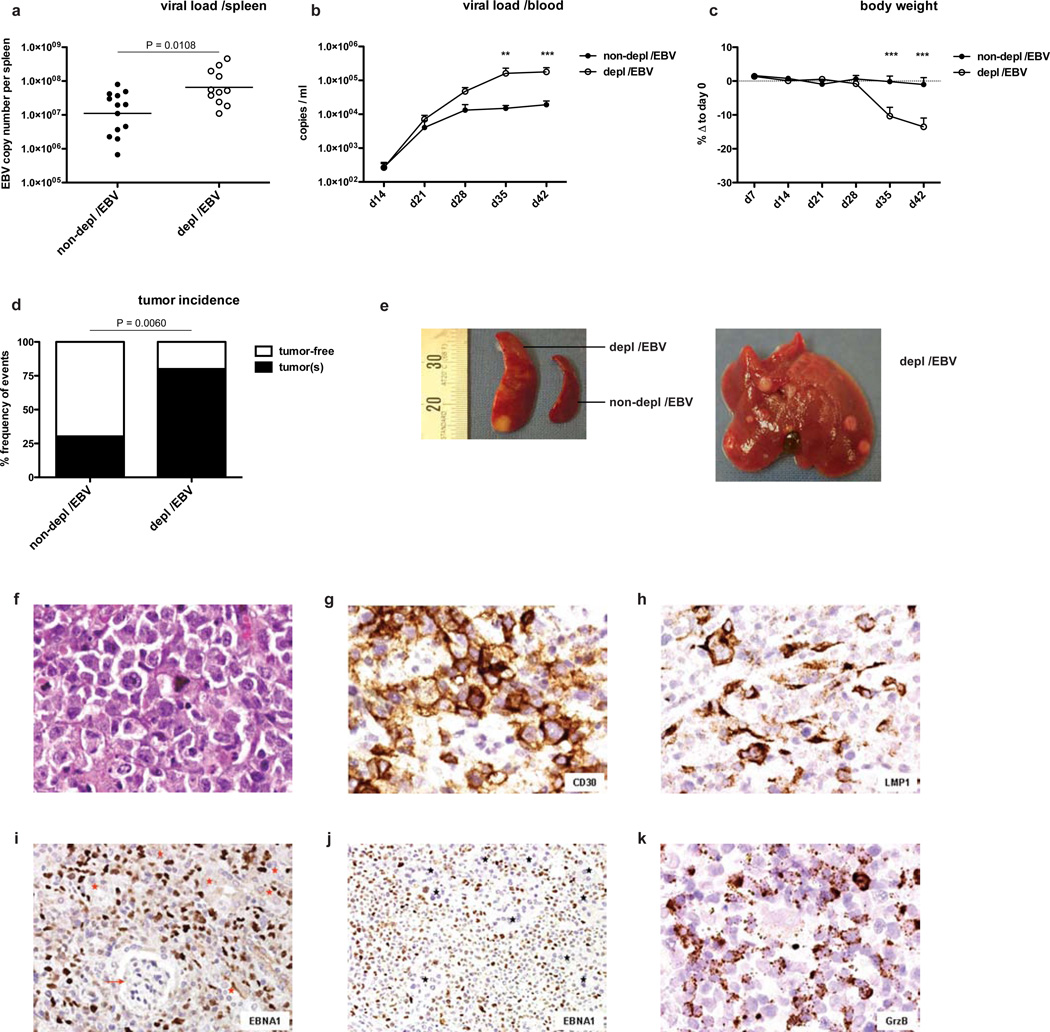
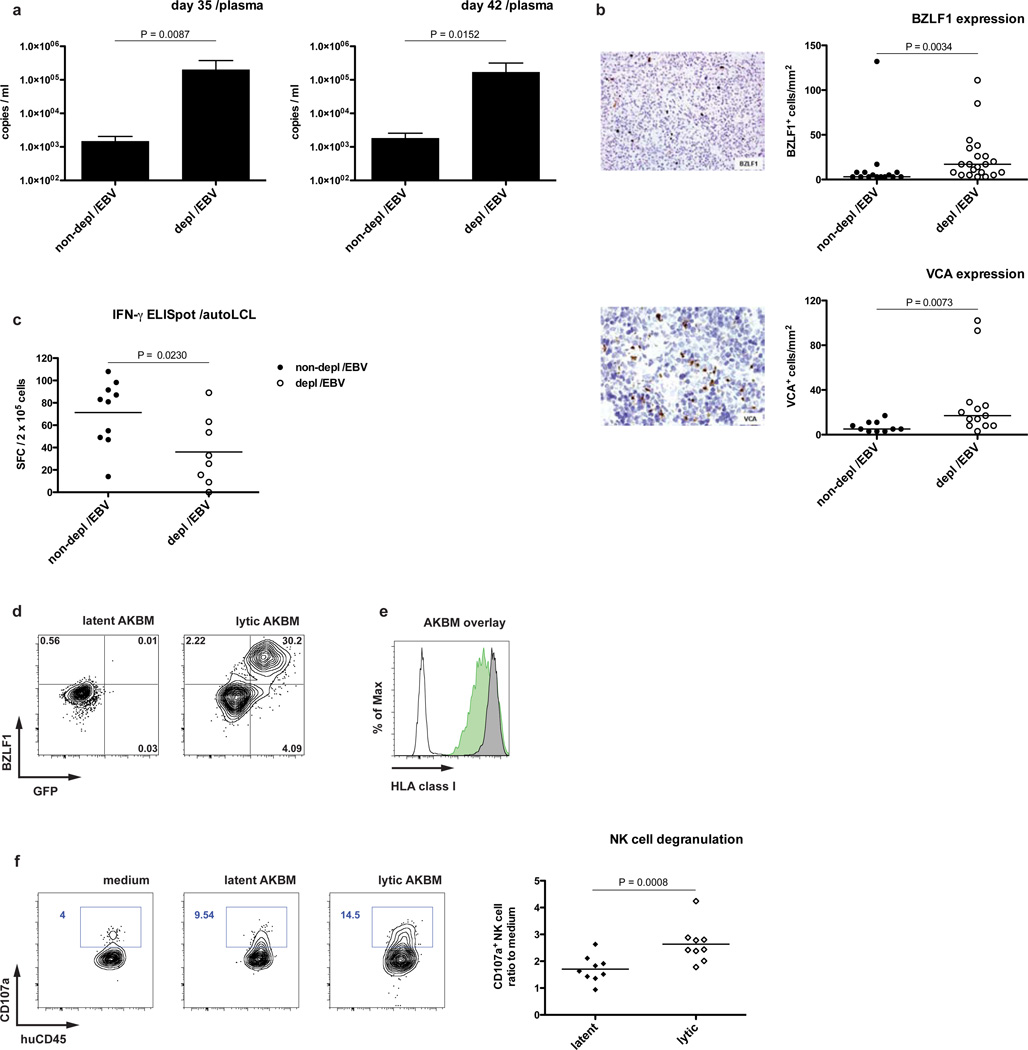
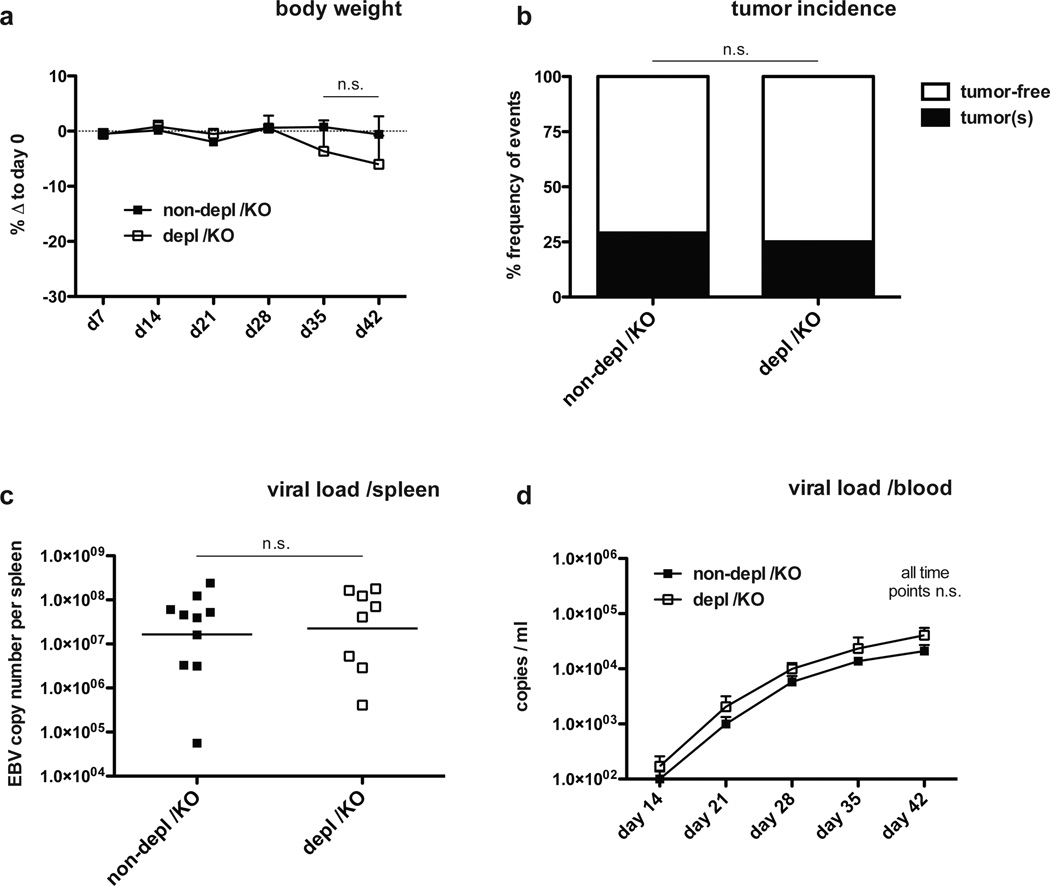
Primary infection with the human oncogenic Epstein-Barr virus (EBV) can result in infectious mononucleosis (IM), a self-limiting disease caused by massive lymphocyte expansion that predisposes for the development of distinct EBV-associated lymphomas. Why some individuals experience this symptomatic primary EBV infection, whereas the majority acquires the virus asymptomatically, remains unclear. Using a mouse model with reconstituted human immune system components, we show that depletion of human natural killer (NK) cells enhances IM symptoms and promotes EBV-associated tumorigenesis mainly because of a loss of immune control over lytic EBV infection. These data suggest that failure of innate immune control by human NK cells augments symptomatic lytic EBV infection, which drives lymphocyte expansion and predisposes for EBV-associated malignancies.


Figures

Figure 1
Figure 1. Human NK cells curb human CD8+ T cell expansion during EBV infection
a–d, frequency and absolute numbers of CD8+ T cells in spleen (a) and blood (c) six weeks after EBV infection in animals with (depl/EBV) and without (non-depl /EBV) NK cell depletion and in non-infected animals (ctrl). Frequency and absolute number of CD4+ T cells in spleen six weeks p.i. (b) and CD8-CD4 ratio over time p.i. in blood (d, *P<0.05, two-way analysis of variance (ANOVA) with Bonferroni correction). CD4+ and CD8+ T cells were identified within live huCD45+CD3+ cells. n=9–34, mean ± s.e.m. e, concentration of human IFN-γ in serum six weeks p.i. in animals with and without NK cell depletion and in non-infected animals (n=18, mean ± s.e.m.). f–g, relative expression of IFN-γ mRNA normalized to 18S in CD4+ T cells (f) and CD8+ T cells (g) sorted from splenocytes of non-infected animals (ctrl), animals without (non-depl /EBV) and with NK cell depletion (depl /EBV) six weeks after EBV infection. Shown is one representative experiment of three independent experiments. n=8, mean ± s.e.m. h, ratio spleen to body weight (BW) six weeks p.i. in animals with and without NK cell depletion and in non-infected animals (n=38, bar represents mean). Data represent composite data from two to four independent experiments. i–j, viral titers in spleen six weeks after EBV infection in animals without depletion (ctrl /EBV), animals depleted of NK cells (NK depl /EBV) and animals depleted of both NK and CD8+ T cells (NK & CD8 depl /EBV) (i, n=15, horizontal bar represents geometric mean, two-tailed Mann Whitney test) and (j) whole blood at various time points p.i. in animals depleted of both NK and CD8+ T cells (NK & CD8 depl /EBV) and animals depleted of NK cells (NK depl /EBV) only (n=10–13 per time point, mean ± s.e.m., ***P<0.001, two-way analysis of variance (ANOVA) with Bonferroni correction). Data represent composite data from two independent experiments.
Figure 2
Figure 2. EBV infection drives an initial expansion and an early differentiation phenotype of human NK cells
a, frequency and number of splenic NK cells six weeks after EBV infection in animals with (depl /EBV) and without (non-depl /EBV) NK cell depletion and in non-infected animals (ctrl), respectively, with representative plots. n=22, mean ± s.e.m. b, frequency of peripheral NK cells in non-depleted animals at day zero, day 28 p.i., day 42 p.i. and non-infected animals, respectively (n=27, mean ± s.e.m.). c, expression of CD16 on peripheral NK cells in non-depleted EBV infected animals at day zero and day 28 p.i. (n=10) with representative staining for CD16 on pre-gated NK cells. d, frequency of CD16+ NK cells in blood and spleen six weeks p.i. in non-depleted animals (n=9, mean ± s.e.m., one representative experiment for spleen). e–f, expression of CD69 on splenic CD8+ T cells and splenic NK cells, respectively and frequency of LIR-1+ and NKG2A+ splenic NK cells six weeks p.i. with representative staining for NKG2A vs. CD69 on pre-gated splenic NK cells six weeks p.i. (e). Frequency of KIR+ and CD27+ NK cells in peripheral blood with representative staining for CD56 vs. KIR on pre-gated peripheral NK cells and frequency of CD57+ peripheral CD8+ T or NK cells, respectively, six weeks p.i. (f). NK cells were identified as CD3 NKp46+ cells within live huCD45+ cells. n=9–17, mean ± s.e.m. Data represent composite data from two to four independent experiments.
Figure 3
Figure 3. NK cell-depleted animals develop increased viral titers and tumor burden after EBV infection
Viral titers in spleen six weeks after EBV infection in animals with (depl /EBV) and without (non-depl /EBV) NK cell depletion (a, n=24, horizontal bar represents geometric mean, two-tailed Mann Whitney test) and whole blood at various time points p.i. (b, n=21–26 per time point, mean ± s.e.m., **P<0.01, ***P<0.001, two-way analysis of variance (ANOVA) with Bonferroni correction). c, percent body weight loss after EBV infection in animals with and without NK cell depletion at various time points p.i. relative to day 0 (n=15–26 per time point, mean ± s.e.m., ***P<0.001, two-way analysis of variance (ANOVA) with Bonferroni correction). d, incidence of all infiltrative tumors at multiple sites six weeks p.i. in animals with and without NK cell depletion (n=36, Fisher's exact test for actual numbers). All data represent composite data from three to four independent experiments. e, spleen with and without tumor formation from NK cell-depleted or non-depleted animals six weeks p.i., respectively (left picture) and liver from NK cell-depleted animal with multiple tumors (right picture). f–k, tumor morphology. f–h, pleomorphic immunoblasts including occasional Reed-Sternberg like-cells (H&E) (f) and g, pleomorphic immunoblasts showing CD30 expression. h, EBV infected cells with expression of LMP1. Original magnification, 400×. i and j, EBNA1+ (brown nuclear staining) pleomorphic immunoblasts in tumor bearing kidney (i, arrow indicates glomerulus and red stars indicate renal tubules) and pancreatic tumor (j, black stars indicate the pancreatic acini). Original magnification, 200×. k, spleen infiltrated by large numbers of granzyme B+ cells (original magnification, 400×). All tissue derived from animals six weeks p.i.
Figure 4
Figure 4. Loss of NK cell mediated immune control augments lytic EBV infection
a–b, EBV wild-type infection. a, EBV genome copies in plasma five and six weeks p.i. in animals with (depl /EBV) and without (non-depl /EBV) NK cell depletion (n=11–12, mean ± s.e.m., two-tailed Mann Whitney test). b, staining for BZLF-1 (upper left, original magnification, 200×) and VCA (lower left, original magnification, 400×) in splenic sections from NK cell-depleted animals six weeks p.i. with quantification of BZLF-1+ cells per mm2 in animals with and without NK cell depletion (upper right) and VCA+ cells per mm2 in animals with and without NK cell depletion (lower right), n=23–36, horizontal bars represent median, two-tailed Mann Whitney test. c, functional assay (IFN-γ ELISpot) of ex vivo T cell response six weeks p.i. with autologous LCLs as targets and effector CD19+ depleted splenic cells from animals with and without NK cell depletion (E:T = 5:1). n=18, horizontal bar represents mean. d–f, induction of lytic phase in AKBM cells and NK cell response. Staining for BZLF-1 in latent and lytic (induced) AKBM cells versus BMRF-1 driven GFP expression (d). e, HLA class I expression in latent and lytic AKBM cells (latent: grey graph, lytic: green graph, white graph: unstained control). f, degranulation of pre-gated splenic NK cells from infected animals six weeks p.i. towards latent and lytic AKBM cells (n=9, horizontal bar represents mean). All data represent composite data from at least two independent experiments.
Figure 5
Figure 5. Latent EBV infection is not affected by human NK cells
a–d, EBV BZLF-1 KO infection. Body weight loss after EBV BZLF-1 KO infection in animals with (depl /KO) and without (non-depl /KO) NK cell depletion at various time points p.i. (a, n=12, mean ± s.e.m., two-way analysis of variance (ANOVA) with Bonferroni correction). b, tumor incidence six weeks after EBV BZLF-1 KO infection in NK cell-depleted and non-depleted animals (n=15, Fisher's exact test for actual numbers). c–d, viral titers in spleen six weeks p.i. (c, n=18, horizontal bar represents geometric mean, two-tailed Mann Whitney test) and blood at various time points p.i. (d, n=12–18, mean ± s.e.m., *P<0.05, two-way analysis of variance (ANOVA) with Bonferroni correction) in animals with and without NK cell depletion. All data represent composite data from at least two independent experiments.

References

    1. Balfour HH, Jr, Odumade OA, Schmeling DO, Mullan BD, Ed JA, Knight JA, Vezina HE, Thomas W, Hogquist KA. Behavioral, virologic, and immunologic factors associated with acquisition and severity of primary Epstein-Barr virus infection in university students. J Infect Dis. 2013;207:80–88. - PMC - PubMed
    1. Berger C, Day P, Meier G, Zingg W, Bossart W, Nadal D. Dynamics of Epstein-Barr virus DNA levels in serum during EBV-associated disease. J Med Virol. 2001;64:505–512. - PubMed
    1. Bihl F, Pecheur J, Breart B, Poupon G, Cazareth J, Julia V, Glaichenhaus N, Braud VM. Primed antigen-specific CD4+ T cells are required for NK cell activation in vivo upon Leishmania major infection. J Immunol. 2010;185:2174–2181. - PubMed
    1. Bjorkstrom NK, Lindgren T, Stoltz M, Fauriat C, Braun M, Evander M, Michaelsson J, Malmberg KJ, Klingstrom J, Ahlm C, Ljunggren HG. Rapid expansion and long-term persistence of elevated NK cell numbers in humans infected with hantavirus. J Exp Med. 2011;208:13–21. - PMC - PubMed
    1. Brown NA, Liu C, Garcia CR, Wang YF, Griffith A, Sparkes RS, Calame KL. Clonal origins of lymphoproliferative disease induced by Epstein-Barr virus. J Virol. 1986;58:975–978. - PMC - PubMed

Publication types

Substances