. 2013 Dec 26;5(6):1714-24.
doi: 10.1016/j.celrep.2013.11.035. Epub 2013 Dec 19.

A UV-induced genetic network links the RSC complex to nucleotide excision repair and shows dose-dependent rewiring

Affiliations

A UV-induced genetic network links the RSC complex to nucleotide excision repair and shows dose-dependent rewiring

Rohith Srivas et al. Cell Rep. .

Abstract

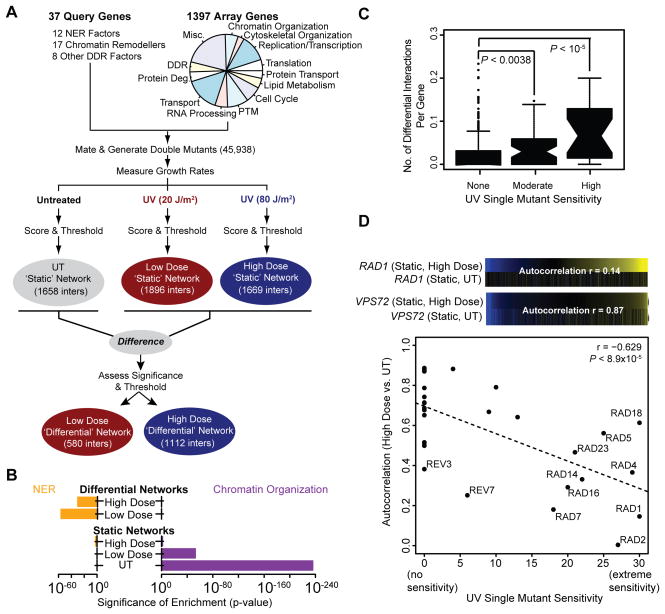
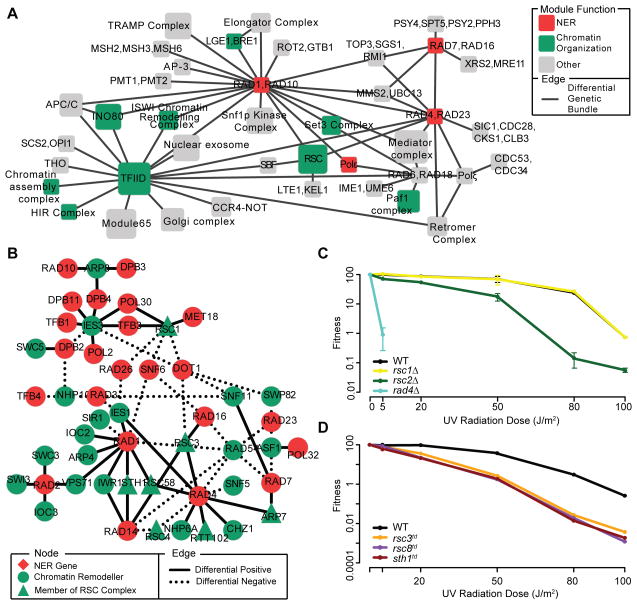
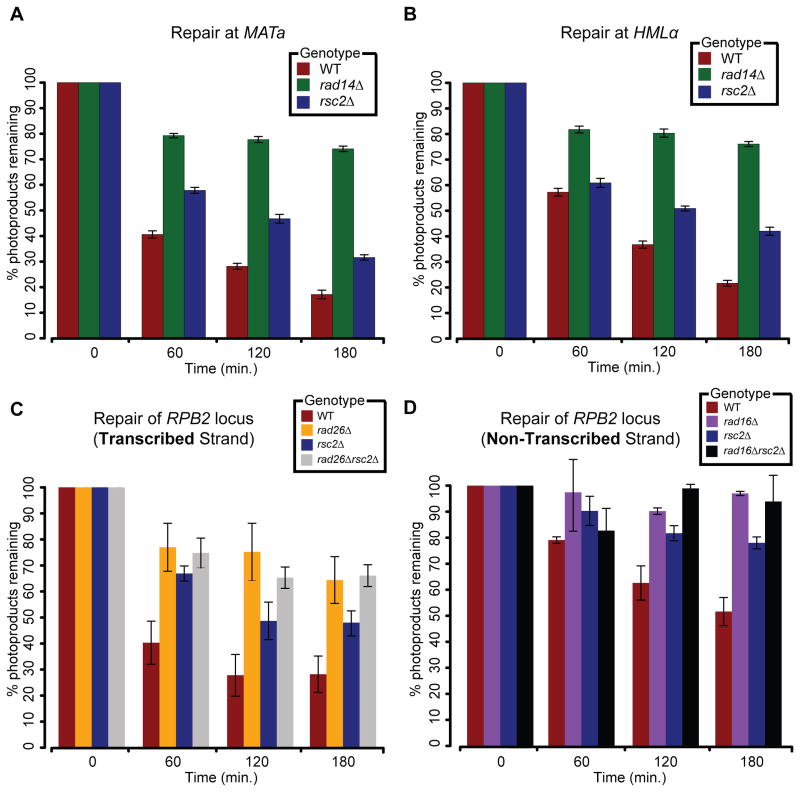
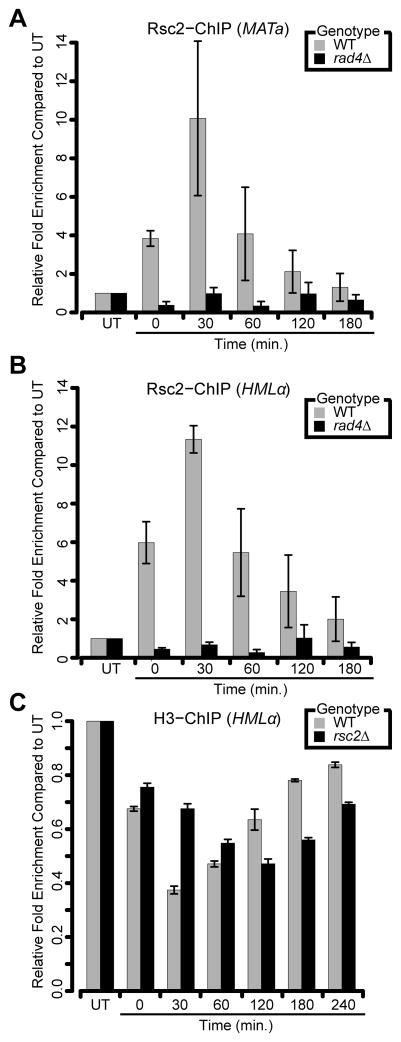
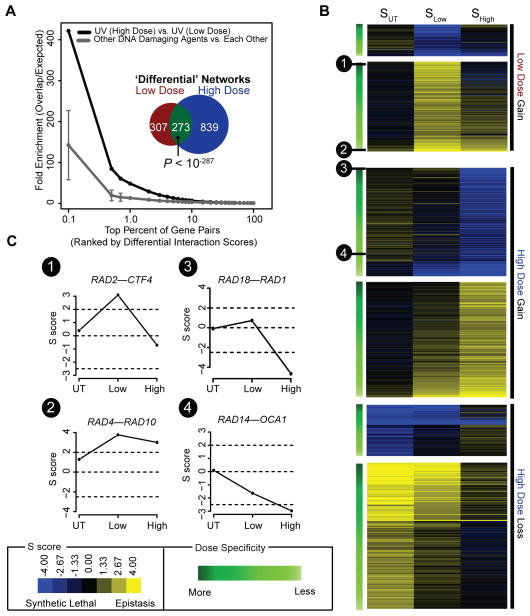
Efficient repair of UV-induced DNA damage requires the precise coordination of nucleotide excision repair (NER) with numerous other biological processes. To map this crosstalk, we generated a differential genetic interaction map centered on quantitative growth measurements of >45,000 double mutants before and after different doses of UV radiation. Integration of genetic data with physical interaction networks identified a global map of 89 UV-induced functional interactions among 62 protein complexes, including a number of links between the RSC complex and several NER factors. We show that RSC is recruited to both silenced and transcribed loci following UV damage where it facilitates efficient repair by promoting nucleosome remodeling. Finally, a comparison of the response to high versus low levels of UV shows that the degree of genetic rewiring correlates with dose of UV and reveals a network of dose-specific interactions. This study makes available a large resource of UV-induced interactions, and it illustrates a methodology for identifying dose-dependent interactions based on quantitative shifts in genetic networks.


Figures

Figure 1
Figure 1. A UV-induced differential genetic network
(A) Outline of the genetic interaction screen. The functional categories represented by the array genes are shown in the pie chart (Misc – Miscellaneous, DDR – DNA Damage Response, Protein Deg. – Protein degradation, PTM – Post-translational modifications). See Table S2 for more details. (B) The significance of enrichment for interactions with genes annotated to Nucleotide Excision Repair (NER) or Chromatin Organization (see Table S7 for process definitions) is shown for each network. Enrichment p-values were calculated as previously described (Bandyopadhyay et al., 2010). (C) Each gene considered in this study is binned according to its UV-induced single mutant sensitivity (Begley et al., 2004) and the distribution of the number of high dose differential interactions for all genes in a bin (# of significant differential interactions/# of tested differential interactions) is summarized as a box-and-whisker plot. Significance is assessed using a Mann-Whitney U test. (D) For each query gene, the Pearson’s correlation between it’s high dose static interaction profile and static untreated profile (‘Autocorrelation’) is plotted against the gene’s UV-induced single mutant sensitivity (Begley et al., 2004). The high dose and untreated static profiles are shown for two query genes: RAD1 and VPS72. See also Figure S1.
Figure 2
Figure 2. Differential genetic data links RSC to NER
(A) A map of multi-genic modules spanned by bundles of UV-induced differential interactions. Node size scales with the number of genes in each module, while the node color indicates its function (see Table S7 for a list of process definitions). Modules that overlap with known protein complexes have been labeled accordingly, otherwise a generic name has been provided. For the sake of clarity only a portion of the module map has been shown here. See Table S5 for the complete list of module-module interactions (B) Differential genetic interactions (PLow–UT or PHigh–UT≤0.03) seen between chromatin remodelers and components of the NER pathway (see Table S7 for a list of process definitions). (C,D) Survival curves for (C) non-essential or (D) essential rsc single mutants following exposure to UV radiation across multiple doses. Survival curves were generated through quantification of the spot dilution assay in Figure S2A and one additional replicate (data not shown). Fitness was calculated by counting the number of colonies present in the most dilute spot containing individual colonies and then dividing the count in UV-treated conditions by the count in untreated conditions. All data represent the mean ± 1 s.e.m. of 2 independent replicates. See also Figures S2 and S3.
Figure 3
Figure 3. RSC is required for efficient TCR- and GGR-NER
(A,B) Rate of photoproduct removal at the (A) MATa and (B) HMLα loci measured in G1-synchronized cells using a sensitive qPCR-based assay (Methods). (C,D) Rate of photoproduct removal on the (C) transcribed and (D) non-transcribed strands of the RPB2 locus measured in G1-synchronized cells using a strand specific repair assay (Methods). All data represent the mean ± 1 s.e.m. of at least 3 independent replicates.
Figure 4
Figure 4. RSC promotes proper nucleosome remodeling following UV-induced damage
(A,B) Analysis of Rsc2-Myc recruitment to either (A) MATa or (B) HMLαfollowing exposure to UV radiation. (C) Analysis of histone H3 occupancy at the HMLα locus following UV exposure in G1-synchronized cells. All data represent the mean ± 1 s.e.m of at least 3 independent replicates. See also Figure S4.
Figure 5
Figure 5. Identifying dose-specific differential interactions
(A) Overlap between high and low UV dose differential networks (black line) or the average overlap seen amongst three previously published differential networks generated in response to distinct genotoxic agents (dark grey line/‘Other DNA Damaging Agents’; (Guenole et al., 2012)). Fold enrichment is defined as n/r, where n is the number of top-ranked gene pairs (x-axis; ranked by differential p-value) common to a pair of networks and r is the number expected at random. Error bars indicate 1 s.d. The inset shows the overlap between all significant differential interactions (PLow–UT, PHigh–UT≤0.001) uncovered in high dose versus low dose conditions. Significance of overlap was assessed using a one-tailed Fisher’s exact test. (B) Heat map of the static dose profiles (SUT → SLow → SHigh) for all 849 and 307 high and low dose differential interactions. Interactions have been categorized as “Gain of Interaction” or “Loss of Interaction” and then ordered (top to bottom) based on their likelihood of being a dose-specific differential interaction. For more details, see Supplementary Methods. (C) Example static dose profiles are shown for four interactions. See also Figure S5.

Similar articles

Cited by

References

    1. Aboussekhra A, Al-Sharif IS. Homologous recombination is involved in transcription-coupled repair of UV damage in Saccharomyces cerevisiae. The EMBO journal. 2005;24:1999–2010. - PMC - PubMed
    1. Bandyopadhyay S, Kelley R, Krogan NJ, Ideker T. Functional maps of protein complexes from quantitative genetic interaction data. PLoS computational biology. 2008;4:e1000065. - PMC - PubMed
    1. Bandyopadhyay S, Mehta M, Kuo D, Sung MK, Chuang R, Jaehnig EJ, Bodenmiller B, Licon K, Copeland W, Shales M, et al. Rewiring of genetic networks in response to DNA damage. Science. 2010;330:1385–1389. - PMC - PubMed
    1. Bean GJ, Ideker T. Differential analysis of high-throughput quantitative genetic interaction data. Genome biology. 2012;13:R123. - PMC - PubMed
    1. Begley TJ, Rosenbach AS, Ideker T, Samson LD. Hot spots for modulating toxicity identified by genomic phenotyping and localization mapping. Molecular cell. 2004;16:117–125. - PubMed

Publication types

MeSH terms

Substances

LinkOut - more resources