

Serum ferritin is associated with non-alcoholic fatty liver disease and decreased Β-cell function in non-diabetic men and women
- PMID: 24360972
- PMCID: PMC3943487
- DOI: 10.1016/j.jdiacomp.2013.11.007
Serum ferritin is associated with non-alcoholic fatty liver disease and decreased Β-cell function in non-diabetic men and women
Abstract
Aims: We sought to determine whether NAFLD is associated with poorer β-cell function and if any β-cell dysfunction is associated with abnormal markers of iron or inflammation.
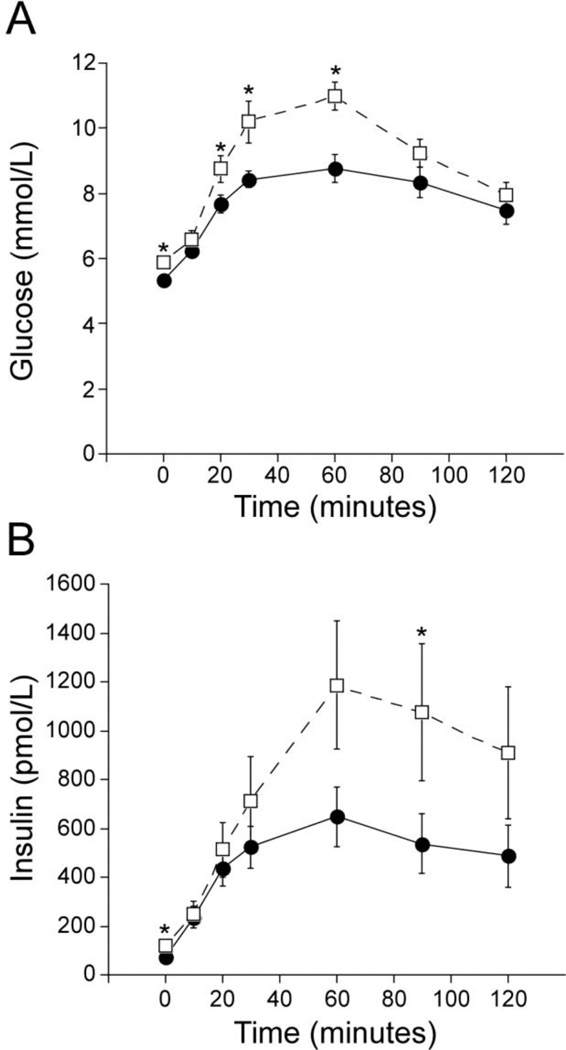
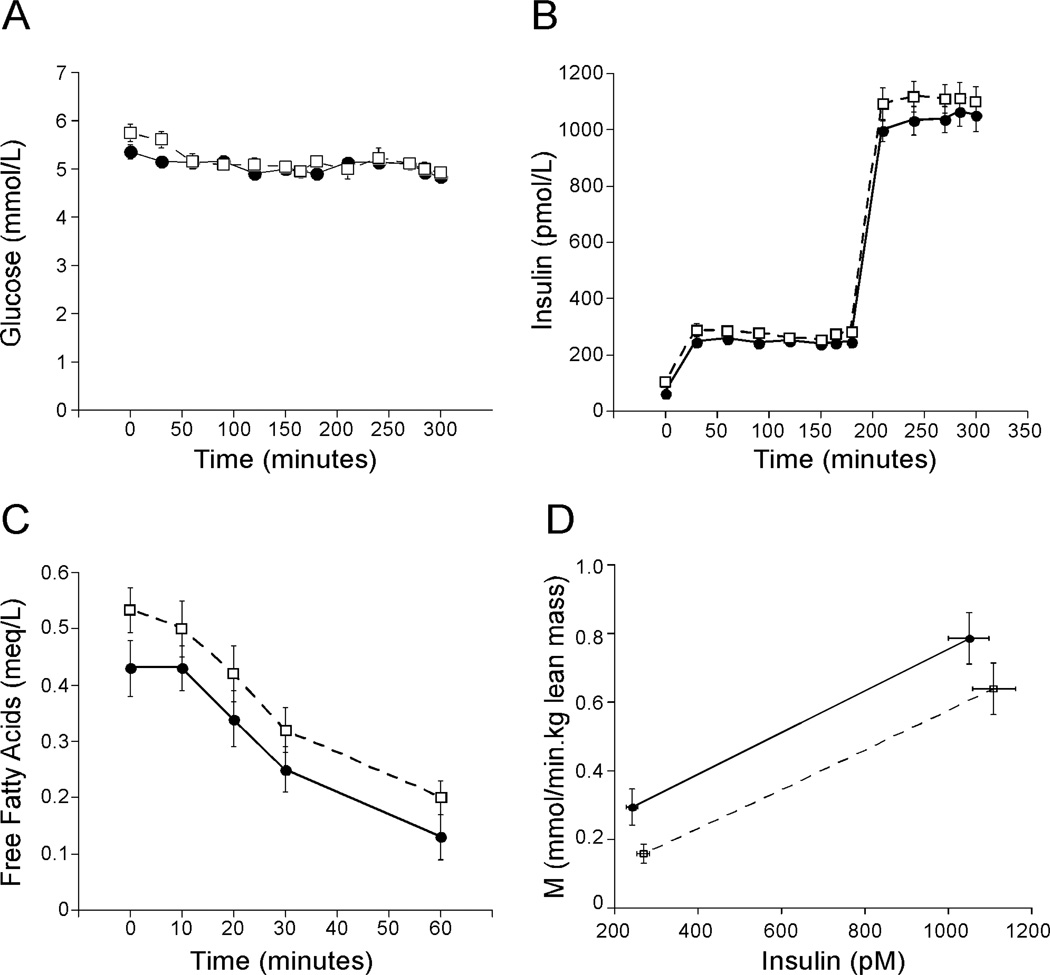
Methods: This was a cross-sectional study of 15 non-diabetic adults with NAFLD and 15 non-diabetic age and BMI-matched controls. Insulin sensitivity was measured by isotope-labeled hyperinsulinemic-euglycemic clamps and β-cell function by both oral (OGTT) and intravenous glucose tolerance tests. Liver and abdominal fat composition was evaluated by CT scan. Fasting serum levels of ferritin, transferrin-iron saturation, IL-6, TNFα and hsCRP were measured.
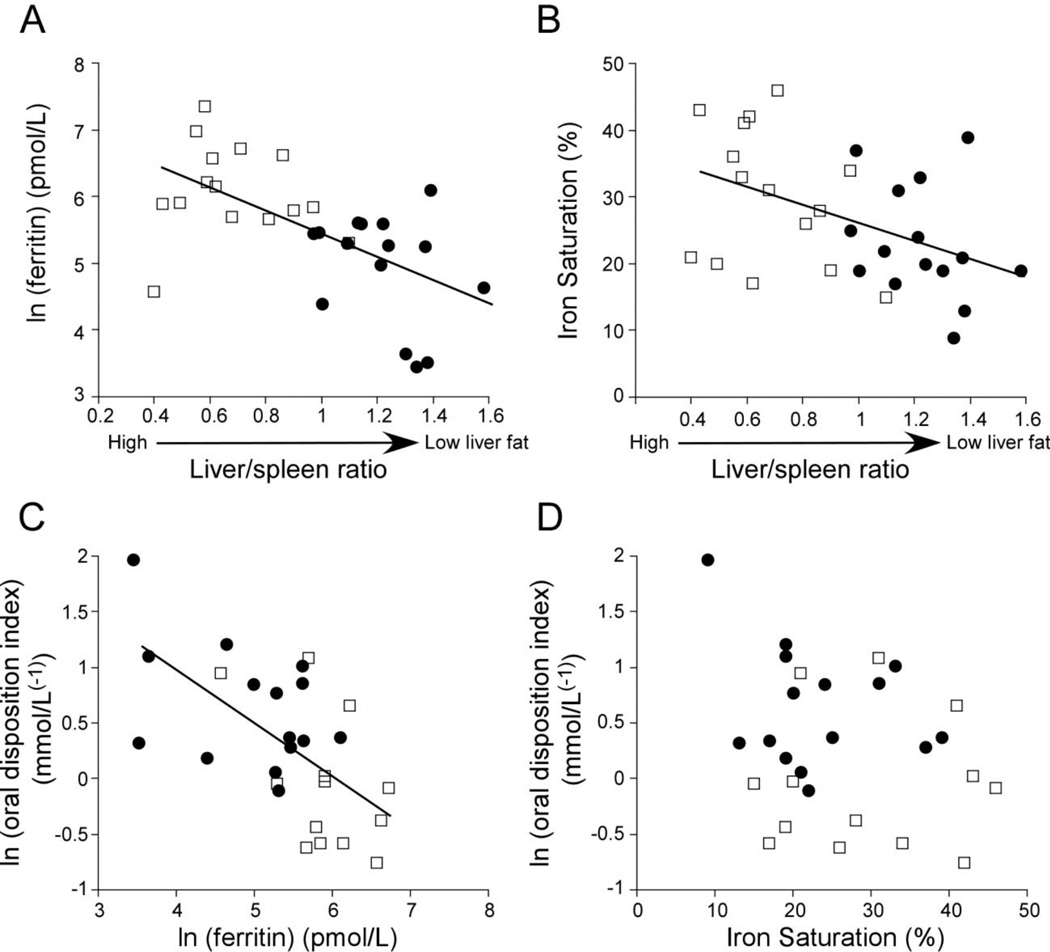
Results: Compared to controls, subjects with NAFLD had lower hepatic and systemic insulin sensitivity and β-cell function was decreased as measured by the oral disposition index. Fasting serum ferritin and transferrin-iron saturation were higher in NAFLD and were positively associated with liver fat. Serum ferritin was negatively associated with β-cell function measured by both oral and intravenous tests, but was not associated with insulin sensitivity. IL-6, TNFα and hsCRP did not differ between groups and did not correlate with serum ferritin, liver fat or measures of β-cell function.
Conclusions: These findings support a potential pathophysiological link between iron metabolism, liver fat and diabetes risk.
Keywords: Fatty liver; Ferritin; Insulin secretion in vivo; Insulin sensitivity.
Published by Elsevier Inc.
Conflict of interest statement
Disclosures: The authors have nothing to disclose. There is no conflict of interest.
Figures
Similar articles
-
Dairy fat intake is associated with glucose tolerance, hepatic and systemic insulin sensitivity, and liver fat but not β-cell function in humans.Am J Clin Nutr. 2014 Jun;99(6):1385-96. doi: 10.3945/ajcn.113.075457. Epub 2014 Apr 16. Am J Clin Nutr. 2014. PMID: 24740208 Free PMC article. Clinical Trial.
-
Serum Ferritin Correlates With Liver Fat in Male Adolescents With Obesity.Front Endocrinol (Lausanne). 2020 Jun 18;11:340. doi: 10.3389/fendo.2020.00340. eCollection 2020. Front Endocrinol (Lausanne). 2020. PMID: 32625166 Free PMC article.
-
Hepatic Insulin Extraction in NAFLD Is Related to Insulin Resistance Rather Than Liver Fat Content.J Clin Endocrinol Metab. 2019 May 1;104(5):1855-1865. doi: 10.1210/jc.2018-01808. J Clin Endocrinol Metab. 2019. PMID: 30566676 Free PMC article.
-
Diagnostic and therapeutic implications of the association between ferritin level and severity of nonalcoholic fatty liver disease.World J Gastroenterol. 2012 Aug 7;18(29):3782-6. doi: 10.3748/wjg.v18.i29.3782. World J Gastroenterol. 2012. PMID: 22876027 Free PMC article. Review.
-
Iron and non-alcoholic fatty liver disease.World J Gastroenterol. 2016 Sep 28;22(36):8112-22. doi: 10.3748/wjg.v22.i36.8112. World J Gastroenterol. 2016. PMID: 27688653 Free PMC article. Review.
Cited by
-
The association between non-alcoholic fatty liver disease and serum ferritin levels in American adults.J Clin Lab Anal. 2022 Feb;36(2):e24225. doi: 10.1002/jcla.24225. Epub 2022 Jan 7. J Clin Lab Anal. 2022. PMID: 34997649 Free PMC article.
-
Serum Ferritin and Non-alcoholic Fatty Liver Disease: A Meta-analysis and Systematic Review.Turk J Gastroenterol. 2023 Sep;34(9):952-960. doi: 10.5152/tjg.2023.22453. Turk J Gastroenterol. 2023. PMID: 37674440 Free PMC article.
-
Pleiotropic actions of iron balance in diabetes mellitus.Rev Endocr Metab Disord. 2015 Mar;16(1):15-23. doi: 10.1007/s11154-014-9303-y. Rev Endocr Metab Disord. 2015. PMID: 25520048 Review.
-
Association between central obesity indices and iron status indicators among Qatari adults.PLoS One. 2021 Apr 29;16(4):e0250759. doi: 10.1371/journal.pone.0250759. eCollection 2021. PLoS One. 2021. PMID: 33914792 Free PMC article.
-
Determinants of hyperglucagonemia in pediatric non-alcoholic fatty liver disease.Front Endocrinol (Lausanne). 2022 Sep 5;13:1004128. doi: 10.3389/fendo.2022.1004128. eCollection 2022. Front Endocrinol (Lausanne). 2022. PMID: 36133310 Free PMC article.
References
-
- Utzschneider KM, Kahn SE. Review: The role of insulin resistance in nonalcoholic fatty liver disease. The Journal of Clinical Endocrinology and Metabolism. 2006;91:4753–4761. - PubMed
-
- Rijkelijkhuizen JM, Doesburg T, Girman CJ, Mari A, Rhodes T, Gastaldelli A, Nijpels G, Dekker JM. Hepatic fat is not associated with beta-cell function or postprandial free fatty acid response. Metabolism. 2009;58:196–203. - PubMed
Publication types
MeSH terms
Substances
Grants and funding
LinkOut - more resources
Full Text Sources
Other Literature Sources
Medical
