. 2014 Jan 7;19(1):122-34.
doi: 10.1016/j.cmet.2013.11.015. Epub 2013 Dec 19.

Argonaute2 mediates compensatory expansion of the pancreatic β cell

Affiliations

Argonaute2 mediates compensatory expansion of the pancreatic β cell

Sudhir G Tattikota et al. Cell Metab. .

Abstract

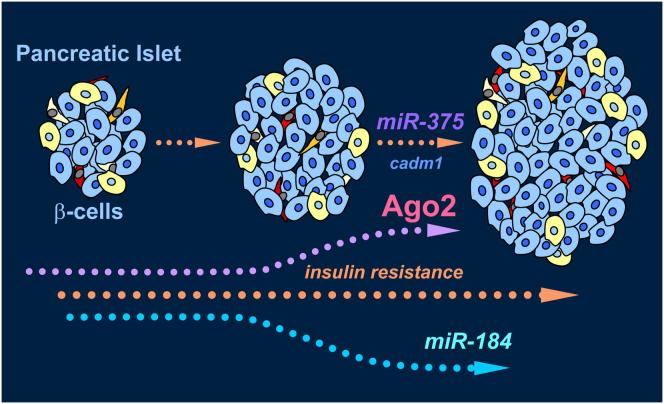
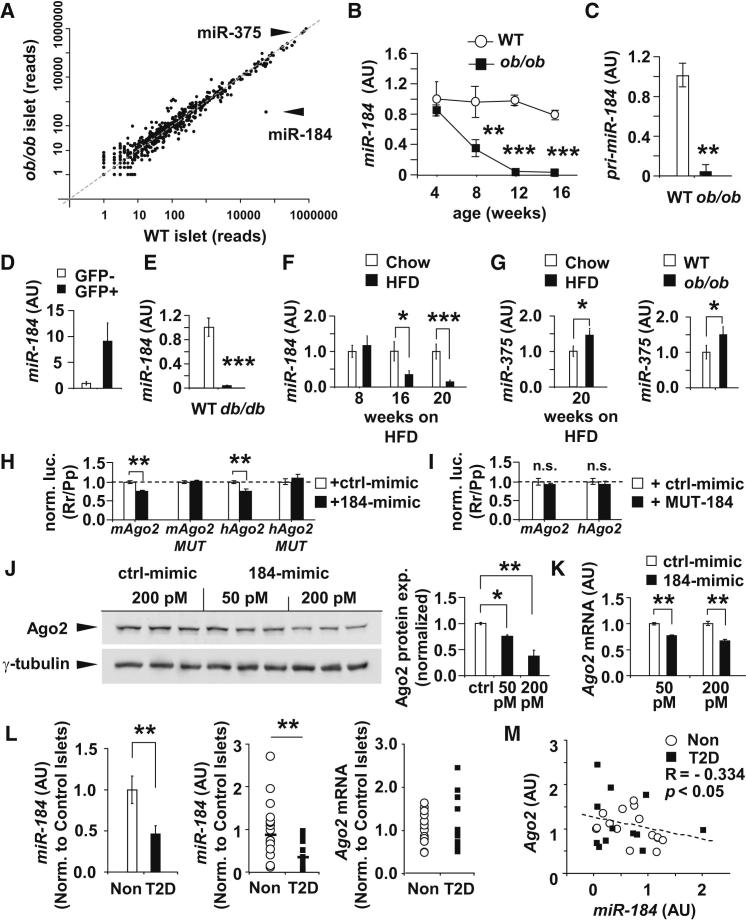
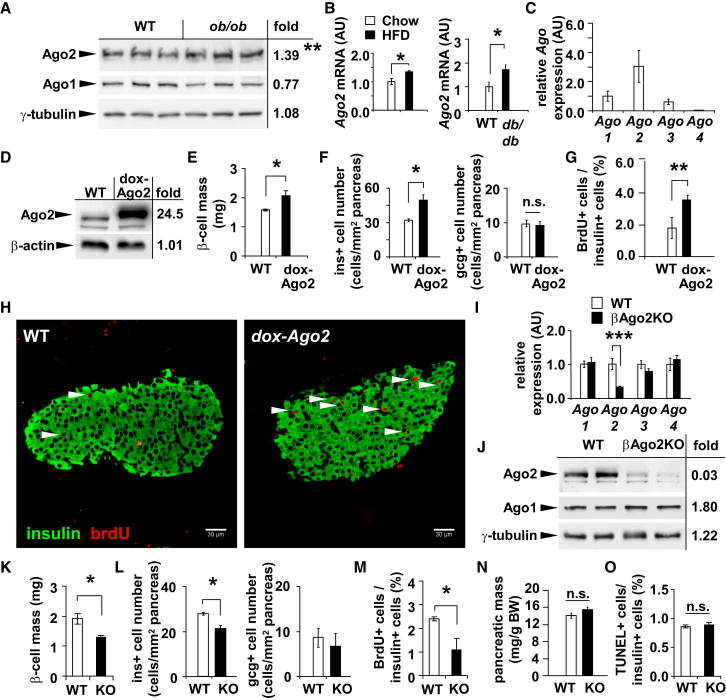
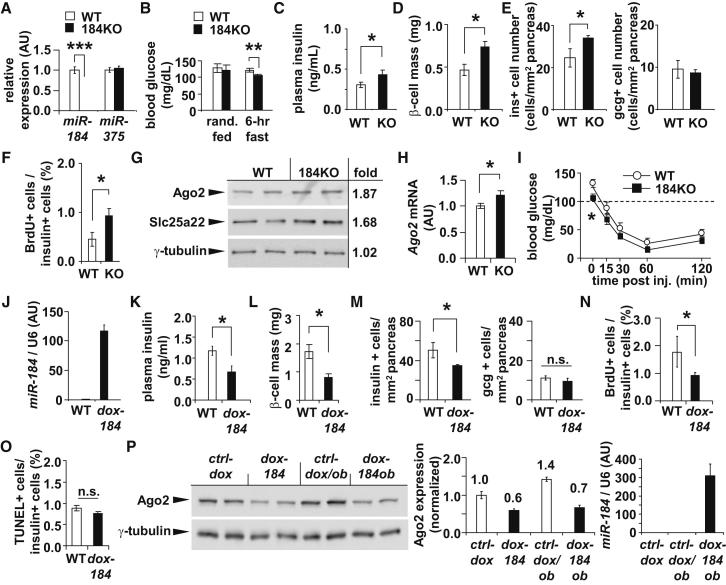
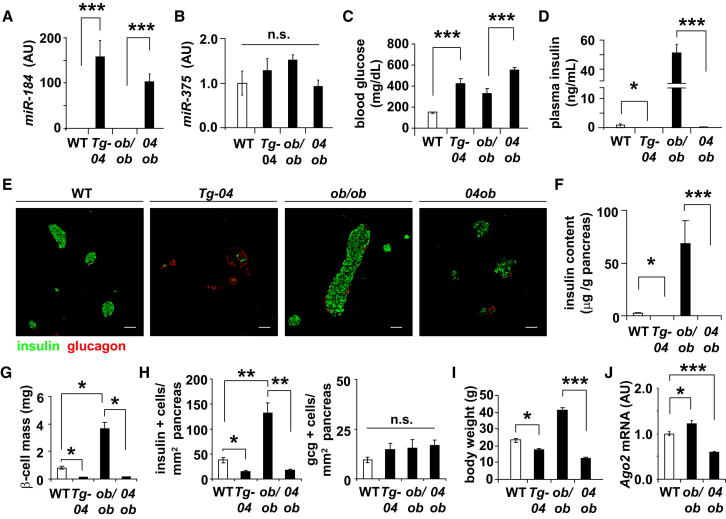
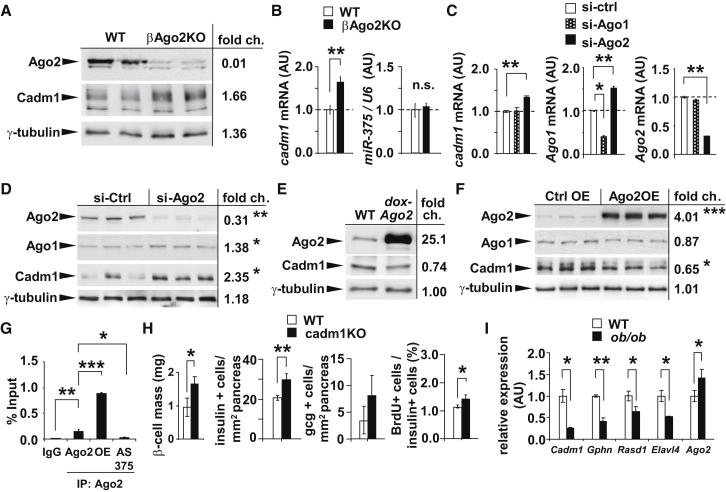
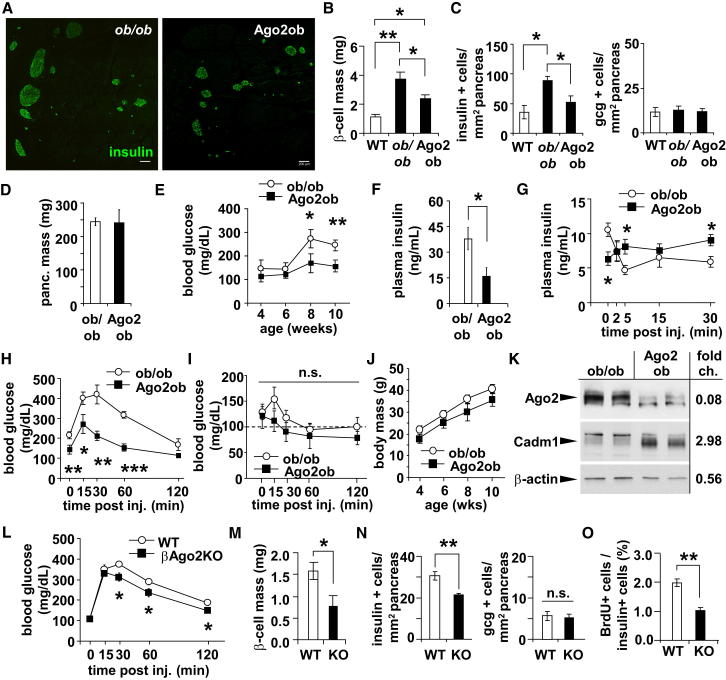
Pancreatic β cells adapt to compensate for increased metabolic demand during insulin resistance. Although the microRNA pathway has an essential role in β cell proliferation, the extent of its contribution is unclear. Here, we report that miR-184 is silenced in the pancreatic islets of insulin-resistant mouse models and type 2 diabetic human subjects. Reduction of miR-184 promotes the expression of its target Argonaute2 (Ago2), a component of the microRNA-induced silencing complex. Moreover, restoration of miR-184 in leptin-deficient ob/ob mice decreased Ago2 and prevented compensatory β cell expansion. Loss of Ago2 during insulin resistance blocked β cell growth and relieved the regulation of miR-375-targeted genes, including the growth suppressor Cadm1. Lastly, administration of a ketogenic diet to ob/ob mice rescued insulin sensitivity and miR-184 expression and restored Ago2 and β cell mass. This study identifies the targeting of Ago2 by miR-184 as an essential component of the compensatory response to regulate proliferation according to insulin sensitivity.


Figures

None
Graphical abstract
Figure 1
Figure 1
miR-184 Is Silenced during Insulin Resistance and Directly Targets Argonaute2 (A) Comparison of small RNA sequencing analysis from total RNA from islets of 12-week-old ob/ob and wild-type (WT) littermates. (B) Quantitative real-time PCR analysis of miR-184 in islets of ob/ob and WT mice from 4–16 weeks of age (n = 3–5). (C) Quantitative real-time PCR analysis of pri-miR-184 in islets of ob/ob mice and WT littermates at 16 weeks of age (n = 3–5). (D) Quantitative real-time PCR analysis of miR-184 in FACS-sorted β cells from 16-week-old mouse insulin promoter-GFP mice (n = 6). (E) Quantitative real-time PCR analysis of miR-184 in islets of db/db mice and WT littermates at age 12 weeks (n = 4). (F) Quantitative real-time PCR analysis of miR-184 in islets of C57BL/6 mice on high-fat diet (HFD) or chow diet. (G) Quantitative real-time PCR analysis of miR-375 in islets of C57BL/6 mice on HFD or chow diet and in islets of ob/ob mice and littermates at age 12 weeks (n = 6). (H and I) Luciferase assays in MIN6 cells testing direct targeting of mouse and human Ago2 genes by miR-184 (184-mimic) or mutant (MUT-184). (J and K) Western blot and quantitative real-time PCR analysis of Ago2 after transfection of miR-184-mimic and scrambled control. (L) Quantitative real-time PCR analysis of miR-184 and Ago2 in islets from nondiabetic (Non) and type-2 diabetic human subjects (T2D) after normalization to RNU6b and TBP, respectively, expressed as fraction of control islets. p values represent a Mann-Whitney significance test (p = 0.009 for miR-184). (M) Correlation of quantitative real-time PCR analysis from (L) of Ago2 and miR-184 in individual T2D (n = 12) and nondiabetic (n = 15) human subjects. Results presented as mean ± SEM. p < 0.05; ∗∗p < 0.01; ∗∗∗p < 0.001. See also Figure S1 and Tables S1 and S2.
Figure 2
Figure 2
Argonaute2 Is Increased during Insulin Resistance and Promotes β-Cell Proliferation (A) Western blot analysis of Ago1 and Ago2 from islets of 8-week-old ob/ob mice and wild-type (WT) littermates. (B) Quantitative real-time PCR analysis of Ago2 in islets after 16 weeks HFD and from 12-week-old db/db mice (n = 3–6). (C) Quantitative real-time PCR analysis of Argonaute genes in FACS-sorted β cells from 12-week-old MIP-GFP mice (n = 3). (D) Western blot analysis of Ago2 from islets of 10-week-old dox-Ago2 mice (line 30) and WT littermates. (E) β cell mass analysis of 10-week-old dox-Ago2 mice (line 30) and WT (n = 3). (F) Morphometric analysis of insulin+ and glucagon+ cells in dox-Ago2 and WT at age 10 weeks (n = 5–6). (G and H) Ratio of BrdU (red) and insulin+ cells (green) in 10-week-old dox-Ago2 mice and WT littermates (n = 4) after immunostaining. Scale bars = 30 μm. (I) Quantitative real-time PCR analysis of Argonaute family members in islets of 10-week-old βAgo2KO mice and littermates (n = 4). (J) Western blot analysis of Ago2 and Ago1 from islets of 10-week-old βAgo2KO mice and WT. (K) β cell mass analysis of 10-week-old βAgo2KO and WT mice (n = 3). (L) Morphometric analysis of insulin+ and glucagon+ cells in βAgo2KO and littermates at 10 weeks of age (n = 5–6). (M) Ratio of BrdU+ and insulin+ cells in βAgo2KO and littermates at 10 weeks of age (n = 5–6). (N) Pancreatic mass to total body mass ratio of βAgo2KO and littermates at 10 weeks of age (n = 5). (O) Ratio of TUNEL+ and insulin+ cells in βAgo2KO and littermates (n = 3). Results presented as mean ± SEM. p < 0.05; ∗∗p < 0.01. See also Figure S2.
Figure 3
Figure 3
miR-184 Regulates Ago2 and Pancreatic β-Cell Proliferation In Vivo (A) Quantitative real-time PCR analysis of miR-184 and miR-375 in islets of 10-week-old 184KO mice and wild-type (WT) littermates (n = 4). (B) Blood glucose of 10-week-old 184KO mice and littermates (n = 4). (C) Fasted plasma insulin levels of 10-week-old 184KO mice and littermates (n = 4). (D) β cell mass analysis of 10-week-old 184KO and WT mice (n = 4). (E) Morphometric analysis of insulin+ and glucagon+ cells in 184KO and WT at 10 weeks of age (n = 3). (F) Ratio of BrdU (red) and insulin+ cells (green) in 12-week-old 184KO mice and WT (n = 3). (G) Western blot analysis of Ago2, Slc25a22, and γ-tubulin from islets of 184KO mice and WT. (H) Quantitative real-time PCR analysis of Ago2 in islets of 10-week-old 184KO mice and littermates (n = 4–5). (I) Blood glucose levels during an ITT on 10-week-old 184KO mice and WT (n = 4–5). (J) Quantitative real-time PCR analysis of miR-184 in islets of 12-week-old dox-184 mice and WT mice after 15 days on doxycycline (n = 4). (K) Plasma insulin levels of 10-week-old dox-184 mice and WT after 15 days on doxycycline (n = 4). (L) β cell mass analysis of 10-week-old dox-184 mice and WT after 15 days on doxycycline (n = 3). (M) Morphometric analysis of insulin+ and glucagon+ cells in 10-week-old dox-184 mice and WT (n = 4). (N) Ratio of BrdU and insulin+ cells in dox-184 mice and WT (n = 4). (O) Ratio of TUNEL+ and insulin+ cells in dox-184 mice and WT (n = 3). (P) Western blot analysis of Ago2 and γ-tubulin after ex vivo treatment of doxycycline on the islets of dox-184 and dox-184ob mice compared to islets from respective control lean or ob/ob littermates. Densitometry is normalized to γ-tubulin expression of ctrl-dox islets. Quantitative real-time PCR analysis of miR-184 in dox-184ob mice and ob/ob littermates. Results presented as mean ± SEM. p < 0.05; ∗∗p < 0.01. See also Figure S3.
Figure 4
Figure 4
Restoration of miR-184 during Insulin Resistance Inhibits Compensatory β-Cell Proliferation (A) Quantitative real-time PCR analysis of miR-184 in islets of 8-week-old wild-type (WT), Tg-04, ob/ob, and 04ob mice (n = 3). (B) Quantitative real-time PCR analysis of miR-375 in islets of 8-week-old WT, Tg-04, ob/ob, and 04ob mice (n = 4). (C) Random blood glucose of 8-week-old WT, Tg-04, ob/ob, and 04ob mice (n = 4–12). (D) Plasma insulin concentrations of 8-week-old WT, Tg-04, ob/ob, and 04ob mice (n = 3–6). (E) Immunostaining analysis of pancreatic sections in 8-week-old WT, Tg-04, ob/ob, and 04ob mice for insulin (green) and glucagon (red). Scale bars = 50 μm. (F) Pancreatic insulin content in 8-week-old WT, Tg-04, ob/ob, and 04ob mice (n = 4–6). (G) β cell mass analysis of 10-week-old WT, Tg-04, ob/ob, and 04ob mice (n = 3). (H) Quantification of insulin+ and glucagon+ cells per area of pancreas in WT, Tg-04, ob/ob, and 04ob mice (n = 4). (I) Body weight analysis of WT, Tg-04, ob/ob, and 04ob mice (n = 4–12). (J) Quantitative real-time PCR analysis of Ago2 in islets of 10-week-old WT, ob/ob, and 04ob mice (n = 4–5). Results presented as mean ± SEM. p < 0.05; ∗∗p < 0.01; ∗∗∗p < 0.001. See also Figure S4.
Figure 5
Figure 5
Argonaute2 Mediates miR-375 Function in the Pancreatic β-Cell (A) Western blot analysis of Ago2 and Cadm1 from islets of 10-week-old βAgo2KO mice and WT littermates. (B) Quantitative real-time PCR analysis of cadm1 and miR-375 in islets of 10-week-old βAgo2KO mice and WT littermates (n = 4). (C) Quantitative real-time PCR analysis of Cadm1, Ago1, and Ago2 after siRNA-mediated knockdown of Ago1 and Ago2 in MIN6 cells (n = 4). (D) Western blot analysis of Ago2, Ago1, and Cadm1 after siRNA-mediated knockdown of Ago2 compared to scrambled control. (E) Western blot analysis of Ago2 and Cadm1 in islets from 10-week-old dox-Ago2 mice and WT. (F) Western blot analysis of Ago2, Ago1, and Cadm1 after overexpression of Ago2 compared to transfection control. (G) Quantitative real-time PCR analysis of Cadm1 after immunopreciptation of Ago2 from MIN6 cells untransfected (Ago2), after overexpression of Ago2 (OE), and after inhibition of miR-375 with antisense oligonucleotides (AS375) (n = 4). (H) β cell mass, morphometric analysis of insulin+ and glucagon+ cells, and ratio of BrdU to insulin+ cells in 18-week-old cadm1-knockout mice and littermates (n = 4). (I) Quantitative real-time PCR analysis of Cadm1, Gephyrin, Rasd1, Elavl4, and Ago2 in islets of ob/ob and WT mice at 16 weeks of age (n = 5–6). Results presented as mean ± SEM. p < 0.05; ∗∗p < 0.01. See also Figure S5.
Figure 6
Figure 6
Loss of Argonaute2 during Insulin Resistance Inhibits Compensatory Proliferation (A) Immunostaining of pancreatic sections from Ago2ob mice and ob/ob littermates with antibodies to insulin (green) and glucagon (red). Scale bars = 200 μm. (B) β cell mass analysis of 10-week-old wild-type (WT), ob/ob, and Ago2ob mice (n = 3). (C) Morphometric analysis of insulin+ and glucagon+ cells in 10-week-old WT, ob/ob, and Ago2ob (n = 4–5). (D) Pancreatic weight in 10-week-old Ago2ob mice and ob/ob littermates (n = 4–5). (E and F) Random blood glucose and plasma insulin levels of 10-week-old Ago2ob and littermate ob/ob mice (n = 4–5). (G) Plasma insulin levels after glucose bolus on 10-week-old Ago2ob mice and ob/ob littermates (n = 4–5). (H) Blood glucose levels during a GTT on 10-week-old Ago2ob mice and ob/ob littermates (n = 4–5). (I) Blood glucose levels during an ITT on 10-week-old Ago2ob mice and ob/ob littermates (n = 4–5). (J) Body weight of Ago2ob mice and ob/ob mice from 4–10 weeks of age (n = 4–5). (K) Western blot analysis of Ago2 and Cadm1 in islets from 10-week-old Ago2ob mice and ob/ob littermates. (L) Blood glucose levels during a GTT on 16-week-old βAgo2KO mice and littermates after 12 weeks on a HFD (n = 6). (M) β cell mass analysis in 16-week-old βAgo2KO mice and littermates after 12 weeks on a HFD (n = 6). (N and O) Morphometric analysis of insulin+, glucagon+, and BrdU+ cells in 16-week-old βAgo2KO mice and littermates after 12 weeks on a HFD (n = 6). Results presented as mean ± SEM. p < 0.05; ∗∗p < 0.01; ∗∗∗p < 0.001. See also Figure S6.
Figure 7
Figure 7
Administration of the Ketogenic Diet during Insulin Resistance Rescues miR-184 Expression (A) Quantitative real-time PCR analysis of miR-184 and miR-375 in islets of 10-week-old C57BL/6 mice on chow (Chow) or ketogenic diet (Keto) for 24 days (n = 4). (B) Blood glucose levels during an ITT on 10-week-old Chow and Keto mice for 24 days (n = 4–5). (C and D) Plasma insulin and blood glucose levels after glucose challenge on 10-week-old Chow and Keto mice for 24 days (n = 4–5). (E) Quantitative real-time PCR analysis of miR-184 and miR-375 in islets of 16-week-old ob/ob mice on chow or ketogenic diet and WT littermates (n = 4). (F and G) Blood glucose and random plasma insulin levels in 16-week-old ob/ob mice on chow (Chow/ob) or ketogenic diet (Keto/ob) for 15 days (n = 4). (H) Blood glucose levels during an ITT on 16-week-old ob/ob mice on chow or ketogenic diet for 15 days (n = 4–5). (I and J) Plasma insulin and blood glucose levels after glucose challenge on 16-week-old ob/ob mice on chow or ketogenic diet for 15 days (n = 4-5). (K and L) Quantification of β cell mass after immunostaining pancreatic sections for insulin (green) of 16-week-old ob/ob mice on chow or ketogenic diet for 45 days (n = 3). Scale bars = 200 μm. (M) Quantitative real-time PCR analysis of Ago2 and Slc25a22 in islets of 16-week-old ob/ob mice on chow or ketogenic diet (n = 4–5). Results presented as mean ± SEM. p < 0.05; ∗∗p < 0.01; ∗∗∗p < 0.001. See also Figure S7.

Comment in

  • Micro-managing the pancreatic β cell.
    Rathjen T, Tattikota SG, Poy MN. Rathjen T, et al. Cell Cycle. 2014;13(8):1216-7. doi: 10.4161/cc.28513. Epub 2014 Mar 12. Cell Cycle. 2014. PMID: 24621504 Free PMC article. No abstract available.

References

    1. Badman M.K., Kennedy A.R., Adams A.C., Pissios P., Maratos-Flier E. A very low carbohydrate ketogenic diet improves glucose tolerance in ob/ob mice independently of weight loss. Am. J. Physiol. Endocrinol. Metab. 2009;297:E1197–E1204. - PMC - PubMed
    1. Bartel D.P. MicroRNAs: target recognition and regulatory functions. Cell. 2009;136:215–233. - PMC - PubMed
    1. Bolmeson C., Esguerra J.L.S., Salehi A., Speidel D., Eliasson L., Cilio C.M. Differences in islet-enriched miRNAs in healthy and glucose intolerant human subjects. Biochem. Biophys. Res. Commun. 2011;404:16–22. - PubMed
    1. Casimir M., Lasorsa F.M., Rubi B., Caille D., Palmieri F., Meda P., Maechler P. Mitochondrial glutamate carrier GC1 as a newly identified player in the control of glucose-stimulated insulin secretion. J. Biol. Chem. 2009;284:25004–25014. - PMC - PubMed
    1. Charrier C., Machado P., Tweedie-Cullen R.Y., Rutishauser D., Mansuy I.M., Triller A. A crosstalk between β1 and β3 integrins controls glycine receptor and gephyrin trafficking at synapses. Nat. Neurosci. 2010;13:1388–1395. - PubMed

Publication types

Associated data