. 2014 Apr;146(4):1060-9.
doi: 10.1053/j.gastro.2013.12.016. Epub 2013 Dec 17.

Gluconeogenic signals regulate iron homeostasis via hepcidin in mice

Affiliations

Gluconeogenic signals regulate iron homeostasis via hepcidin in mice

Chiara Vecchi et al. Gastroenterology. 2014 Apr.

Abstract

Background & aims: Hepatic gluconeogenesis provides fuel during starvation, and is abnormally induced in obese individuals or those with diabetes. Common metabolic disorders associated with active gluconeogenesis and insulin resistance (obesity, metabolic syndrome, diabetes, and nonalcoholic fatty liver disease) have been associated with alterations in iron homeostasis that disrupt insulin sensitivity and promote disease progression. We investigated whether gluconeogenic signals directly control Hepcidin, an important regulator of iron homeostasis, in starving mice (a model of persistently activated gluconeogenesis and insulin resistance).

Methods: We investigated hepatic regulation of Hepcidin expression in C57BL/6Crl, 129S2/SvPas, BALB/c, and Creb3l3-/- null mice. Mice were fed a standard, iron-balanced chow diet or an iron-deficient diet for 9 days before death, or for 7 days before a 24- to 48-hour starvation period; liver and spleen tissues then were collected and analyzed by quantitative reverse-transcription polymerase chain reaction and immunoblot analyses. Serum levels of iron, hemoglobin, Hepcidin, and glucose also were measured. We analyzed human hepatoma (HepG2) cells and mouse primary hepatocytes to study transcriptional control of Hamp (the gene that encodes Hepcidin) in response to gluconeogenic stimuli using small interfering RNA, luciferase promoter, and chromatin immunoprecipitation analyses.

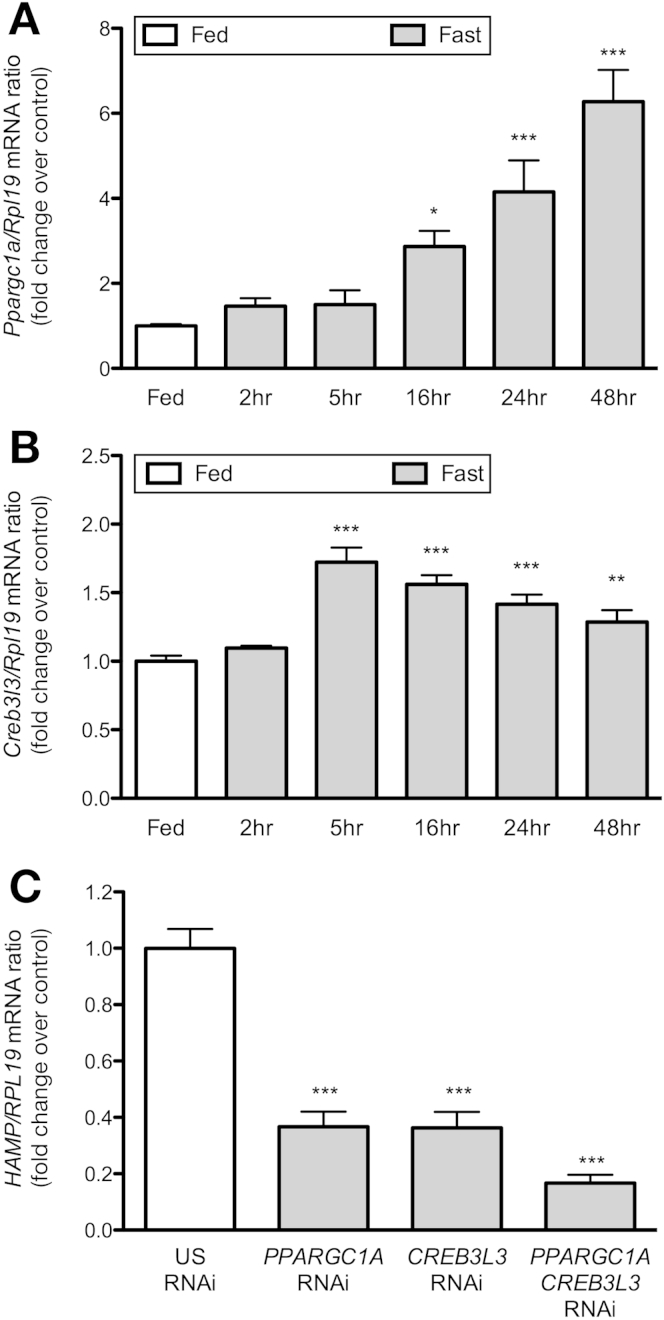
Results: Starvation led to increased transcription of the gene that encodes phosphoenolpyruvate carboxykinase 1 (a protein involved in gluconeogenesis) in livers of mice, increased levels of Hepcidin, and degradation of Ferroportin, compared with nonstarved mice. These changes resulted in hypoferremia and iron retention in liver tissue. Livers of starved mice also had increased levels of Ppargc1a mRNA and Creb3l3 mRNA, which encode a transcriptional co-activator involved in energy metabolism and a liver-specific transcription factor, respectively. Glucagon and a cyclic adenosine monophosphate analog increased promoter activity and transcription of Hamp in cultured liver cells; levels of Hamp were reduced after administration of small interfering RNAs against Ppargc1a and Creb3l3. PPARGC1A and CREB3L3 bound the Hamp promoter to activate its transcription in response to a cyclic adenosine monophosphate analog. Creb3l3-/- mice did not up-regulate Hamp or become hypoferremic during starvation.

Conclusions: We identified a link between glucose and iron homeostasis, showing that Hepcidin is a gluconeogenic sensor in mice during starvation. This response is involved in hepatic metabolic adaptation to increased energy demands; it preserves tissue iron for vital activities during food withdrawal, but can cause excessive iron retention and hypoferremia in disorders with persistently activated gluconeogenesis and insulin resistance.

Keywords: Glucagon; Mouse Model; Peroxisome Proliferator-Activated Receptor-Gamma Co-activator 1-Alpha (PGC1A); cAMP Response Element-Binding Protein-H (CREBH).


Figures

Figure 1
Figure 1
In vivo time course of hepcidin and ferroportin expression in mice during starvation. (A) Real-time qRT-PCR analysis of Pck1 mRNA and (B) Hamp mRNA expression relative to housekeeping Rpl19 mRNA in C57BL/6 mice fed a standard diet (white bar) or starved for the indicated time periods (gray bars). (C) Enzyme-linked immunosorbent assay quantification of serum hepcidin levels. (D) Fpn1 mRNA expression relative to housekeeping Rpl19 mRNA. (E) Western blot analysis of FPN1 protein expression in the liver, with tubulin as loading control. The arrow indicates the specific FPN1 band, whereas the nonspecific upper band is owing to the secondary antibody. (F) Densitometric quantification of FPN1 protein expression relative to tubulin. Results are mean ± SEM of 6–8 mice per group. In Western blot analysis, 3 representative mice per group are shown. For mRNA expression analysis, mean control values for the fed mice group are set to 1. P values are reported for comparisons between fed mice and mice fasted at each time point. *P < .05, ***P < .001.
Figure 2
Figure 2
Fasting induces hepcidin gene expression also in mice premaintained on an iron-deficient diet. Eight- to 10-week-old male C57BL/6Crl mice were fed an iron-balanced diet or an iron-deficient diet for 9 days before death (IB and ID, respectively), or for 6 days before the 24- to 48-hour starvation period (ID fast 24-hr and 48 hr). (A) Serum iron quantification, (B) spleen iron content, (C) hemoglobin (Hb) levels, and (D) Hamp mRNA expression relative to housekeeping Rpl19 mRNA expression. Results are expressed as the mean ± SEM of 5–6 mice per group. P values are reported for comparisons between the indicated groups. *P < .05, **P < .01, ***P < .001.
Figure 3
Figure 3
Ppargc1a and Creb3l3 are induced by starvation and are involved in hepcidin expression. (A) Real-time qRT-PCR analysis of Ppargc1a mRNA and (B) Creb3l3 mRNA expression in liver of C57BL/6 mice fed an iron-standard diet (white bar) and starved for the indicated time points (gray bars). (C) Basal expression of HAMP mRNA in HepG2 cells transfected with siRNAs against PPARGC1A, CREB3L3, or both. Results are mean ± SEM of 6–8 mice per group or 3–4 independent experiments each repeated in triplicate. Mean control values for the fed mice group for in vivo experiments or unspecific (US) RNA interference (RNAi) for in vitro experiments are set to 1 and are normalized relative to housekeeping Rpl19 mRNA. P values are reported for comparisons between control and treated cells, or between indicated groups. *P < .05, **P < .01, ***P < .001.
Figure 4
Figure 4
Hepcidin is induced by gluconeogenic signals through PPARGC1A/CREBH. (A) HepG2 cells were cultured in the presence of a cAMP analog (8Br cAMP) and analyzed at different time points for PCK1 and HAMP mRNA expression by real-time qRT-PCR. (B) Pck1 and Hamp mRNA expression in primary mouse hepatocytes isolated from C57BL/6 mice and exposed to glucagon or 8Br cAMP. (C) HAMP mRNA expression and (D) Hamp-promoter luciferase activity in HepG2 cells after silencing of PPARGC1A and CREB3L3. (E) Hamp-promoter luciferase activity in HepG2 cells transfected with control plasmid (empty) or construct encoding PPARGC1A protein. (F) ChIP assay of HepG2 cells transfected with Flag-tagged CREB3L3-N vector and exposed to 8Br cAMP. CREBH (αFlag) and PPARGC1A (αPGC1A) occupancy of CREBH site on hepcidin endogenous promoter was evaluated by real-time qRT-PCR and expressed as a percentage of the input signal. αGFP (green fluorescent protein) antibody is used as control, unrelated antibody. Results are mean ± SEM of 3–4 independent experiments, each repeated in triplicate. For mRNA and luciferase analysis, mean control values are set to 1. ChIP data are mean ± SEM representative of 2 separate experiments. P values are reported for comparisons (A and B) between control and treated cells, (C–E) between indicated groups, or between αGFP and specific antibodies. *P < .05, **P < .01, ***P < .001.
Figure 5
Figure 5
Starvation fails to induce hepcidin gene expression in Creb3l3-/- mice. Eight- to 10-week-old wild type (WT) or Creb3l3-/- male mice were starved for 24 or 48 hours before death. (A) Pck1 mRNA and (B) Hamp mRNA expression were assessed by real-time qRT-PCR. (C) Enzyme-linked immunosorbent assay quantification of serum hepcidin levels and (D) serum iron levels. (E) Ppargc1a mRNA expression in starved mice. Results are mean ± SEM of 6–8 mice per group. (A, B, and E) Mean control values for the fed mice group are set to 1 and are normalized relative to housekeeping Rpl19 mRNA. P values are reported for comparisons between fed and 24- or 48-hour fasted mice, within each genotype. *P < .05, **P < .01, ***P < .001.
Supplementary Figure 1
Hepatic expression of inflammation or ER stress markers in mice during starvation. Total liver mRNA analysis in liver of C57BL/6 mice fed a standard diet (white bar) and starved for the indicated time points (gray bars). (A–D) Real-time qRT-PCR analysis of cytokine mRNA expression relative to housekeeping Rpl19 mRNA: (A) Il6, (B) Il22, (C) Tnf, and (D) Il1β. (E) Crp mRNA expression, as an inflammatory marker, and (F) PCR analysis of Xbp1 mRNA splicing analysis, as an ER stress marker. Results are mean ± SEM of 6–8 mice per group. For mRNA expression analysis, mean control values for the fed mice group are set to 1. In the Xbp1 splicing analysis, 3 representative mice per group are shown. MW, molecular weight, PC positive control. P values are reported for comparisons between fed mice and fasted mice at each time point. *P < .05.
Supplementary Figure 2
Fasting induces hepcidin gene expression and hypoferremia in vivo in BALB/c and 129S2/SvPas (129S2) wild-type mice. Eight- to 10-week-old (A–C) BALB/c and (D–F) 129S2/SvPas wild-type mice were fasted for 24-48 hours. Real-time qRT-PCR analysis of (A and D) Pck1 mRNA, (B and E) Hamp mRNA, and (C and F) serum iron in fed and fasted mice. Results are expressed as the mean ± SEM of 6–8 mice per group. For mRNA expression analysis in panels A and B and in D and E, the mean control values are set to 1 and are normalized relative to housekeeping Rpl19 mRNA. P values are reported for comparisons between control fed mice and fasted mice. *P < .05, **P < .01, ***P < .001.

References

    1. Spiegelman B.M., Heinrich R. Biological control through regulated transcriptional coactivators. Cell. 2004;119:157–167. - PubMed
    1. Cahill G.F., Jr. Fuel metabolism in starvation. Annu Rev Nutr. 2006;26:1–22. - PubMed
    1. Muhlenhoff U., Lill R. Biogenesis of iron-sulfur proteins in eukaryotes: a novel task of mitochondria that is inherited from bacteria. Biochim Biophys Acta. 2000;1459:370–382. - PubMed
    1. Bekri S., Gual P., Anty R. Increased adipose tissue expression of hepcidin in severe obesity is independent from diabetes and NASH. Gastroenterology. 2006;131:788–796. - PubMed
    1. Mendler M.H., Turlin B., Moirand R. Insulin resistance-associated hepatic iron overload. Gastroenterology. 1999;117:1155–1163. - PubMed

Publication types

MeSH terms