

Faster-X adaptive protein evolution in house mice
- PMID: 24361937
- PMCID: PMC3982706
- DOI: 10.1534/genetics.113.158246
Faster-X adaptive protein evolution in house mice
Abstract
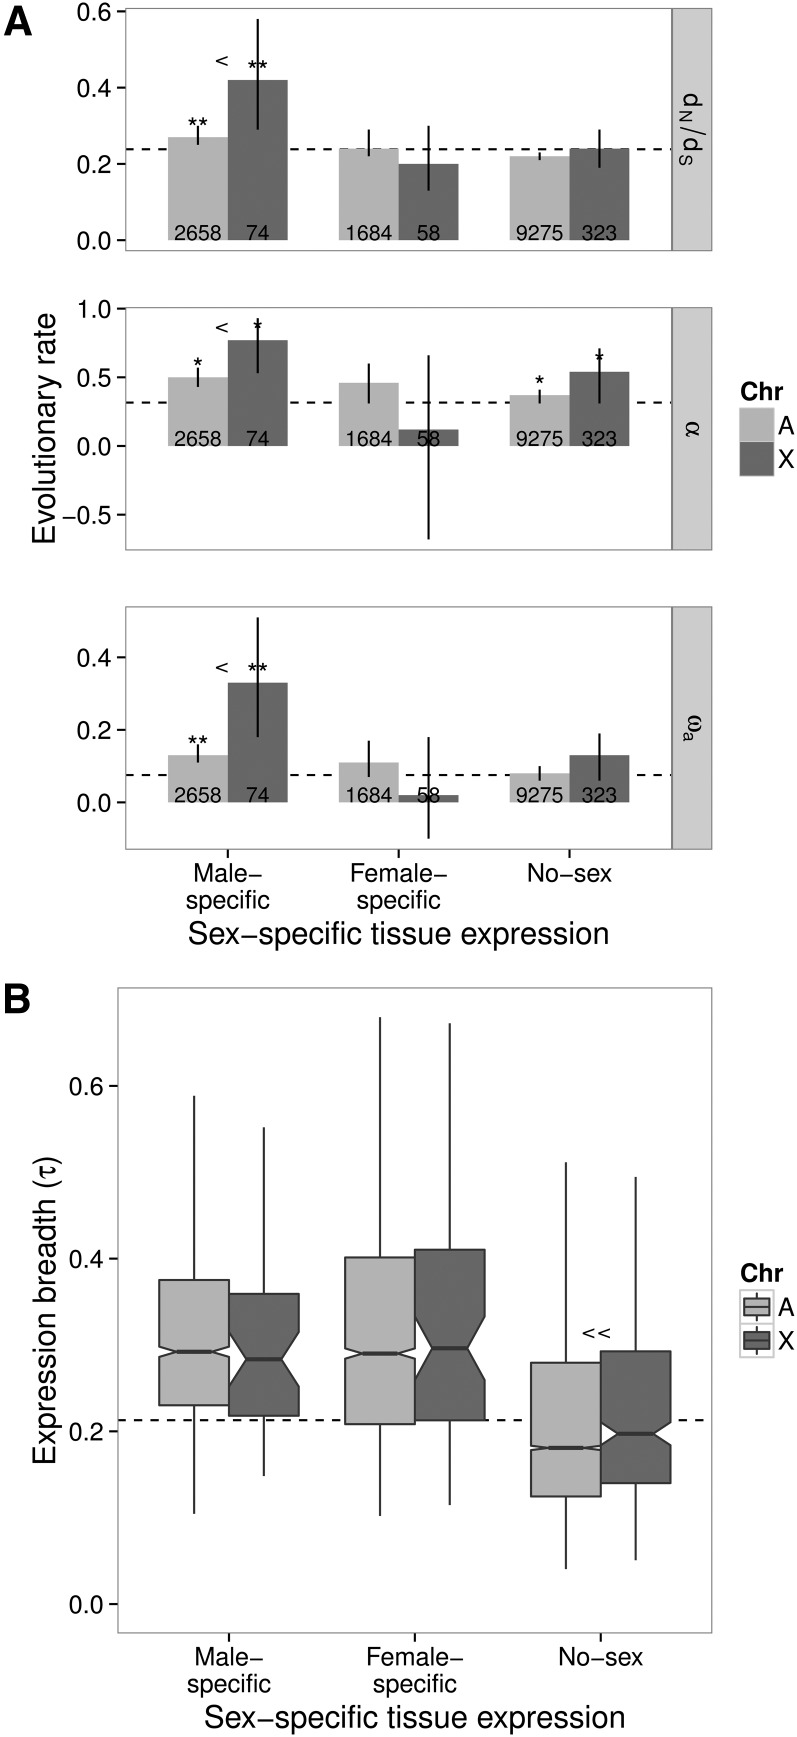
The causes of the large effect of the X chromosome in reproductive isolation and speciation have long been debated. The faster-X hypothesis predicts that X-linked loci are expected to have higher rates of adaptive evolution than autosomal loci if new beneficial mutations are on average recessive. Reproductive isolation should therefore evolve faster when contributing loci are located on the X chromosome. In this study, we have analyzed genome-wide nucleotide polymorphism data from the house mouse subspecies Mus musculus castaneus and nucleotide divergence from Mus famulus and Rattus norvegicus to compare rates of adaptive evolution for autosomal and X-linked protein-coding genes. We found significantly faster adaptive evolution for X-linked loci, particularly for genes with expression in male-specific tissues, but autosomal and X-linked genes with expression in female-specific tissues evolve at similar rates. We also estimated rates of adaptive evolution for genes expressed during spermatogenesis and found that X-linked genes that escape meiotic sex chromosome inactivation (MSCI) show rapid adaptive evolution. Our results suggest that faster-X adaptive evolution is either due to net recessivity of new advantageous mutations or due to a special gene content of the X chromosome, which regulates male function and spermatogenesis. We discuss how our results help to explain the large effect of the X chromosome in speciation.
Keywords: placeholder.
Figures

Similar articles
-
Spermatogenesis and the Evolution of Mammalian Sex Chromosomes.Trends Genet. 2018 Sep;34(9):722-732. doi: 10.1016/j.tig.2018.06.003. Epub 2018 Aug 1. Trends Genet. 2018. PMID: 30077434 Free PMC article. Review.
-
Contrasting Levels of Molecular Evolution on the Mouse X Chromosome.Genetics. 2016 Aug;203(4):1841-57. doi: 10.1534/genetics.116.186825. Epub 2016 Jun 17. Genetics. 2016. PMID: 27317678 Free PMC article.
-
The Composite Regulatory Basis of the Large X-Effect in Mouse Speciation.Mol Biol Evol. 2017 Feb 1;34(2):282-295. doi: 10.1093/molbev/msw243. Mol Biol Evol. 2017. PMID: 27999113 Free PMC article.
-
Inferring the history of speciation in house mice from autosomal, X-linked, Y-linked and mitochondrial genes.Mol Ecol. 2008 Dec;17(24):5349-63. doi: 10.1111/j.1365-294X.2008.04005.x. Mol Ecol. 2008. PMID: 19121002 Free PMC article.
-
The faster-X effect: integrating theory and data.Trends Genet. 2013 Sep;29(9):537-44. doi: 10.1016/j.tig.2013.05.009. Epub 2013 Jun 20. Trends Genet. 2013. PMID: 23790324 Free PMC article. Review.
Cited by
-
Contrasting Evolutionary Trajectories Under Paternal Genome Elimination in Male and Female Citrus Mealybugs.Mol Ecol. 2025 Jul;34(13):e17826. doi: 10.1111/mec.17826. Epub 2025 Jun 9. Mol Ecol. 2025. PMID: 40485618 Free PMC article.
-
Evolutionary Dynamics of Sex Chromosomes of Paleognathous Birds.Genome Biol Evol. 2019 Aug 1;11(8):2376-2390. doi: 10.1093/gbe/evz154. Genome Biol Evol. 2019. PMID: 31329234 Free PMC article.
-
Unraveling patterns of disrupted gene expression across a complex tissue.Evolution. 2022 Feb;76(2):275-291. doi: 10.1111/evo.14420. Epub 2022 Jan 7. Evolution. 2022. PMID: 34882778 Free PMC article.
-
Spermatogenesis and the Evolution of Mammalian Sex Chromosomes.Trends Genet. 2018 Sep;34(9):722-732. doi: 10.1016/j.tig.2018.06.003. Epub 2018 Aug 1. Trends Genet. 2018. PMID: 30077434 Free PMC article. Review.
-
The Evolution of Widespread Recombination Suppression on the Dwarf Hamster (Phodopus) X Chromosome.Genome Biol Evol. 2022 May 31;14(6):evac080. doi: 10.1093/gbe/evac080. Genome Biol Evol. 2022. PMID: 35642315 Free PMC article.
References
-
- Arndt P. F., Petrov D. A., Hwa T., 2003. Distinct changes of genomic biases in nucleotide substitution at the time of mammalian radiation. Mol. Biol. Evol. 20: 1887–1896. - PubMed
-
- Betancourt A. J., Presgraves D. C., Swanson W. J., 2002. A test for faster X evolution in Drosophila. Mol. Biol. Evol. 19: 1816–1819. - PubMed
Publication types
MeSH terms
Grants and funding
LinkOut - more resources
Full Text Sources
Other Literature Sources
