. 2014 Feb;4(2):200-15.
doi: 10.1158/2159-8290.CD-13-0235. Epub 2013 Dec 20.

MEK-dependent negative feedback underlies BCR-ABL-mediated oncogene addiction

Affiliations

MEK-dependent negative feedback underlies BCR-ABL-mediated oncogene addiction

Jennifer Asmussen et al. Cancer Discov. 2014 Feb.

Abstract

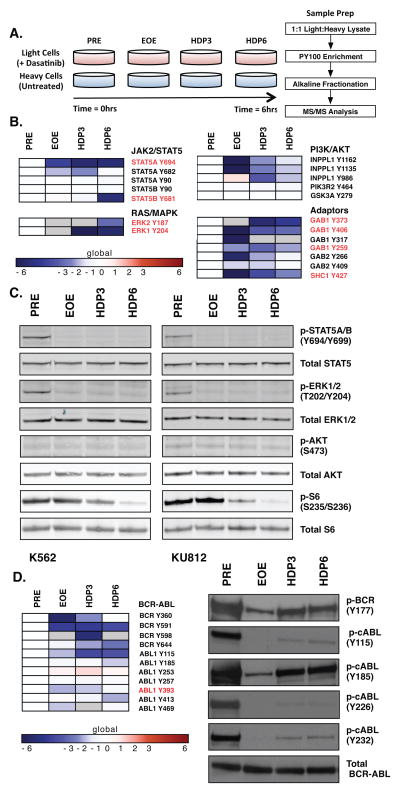
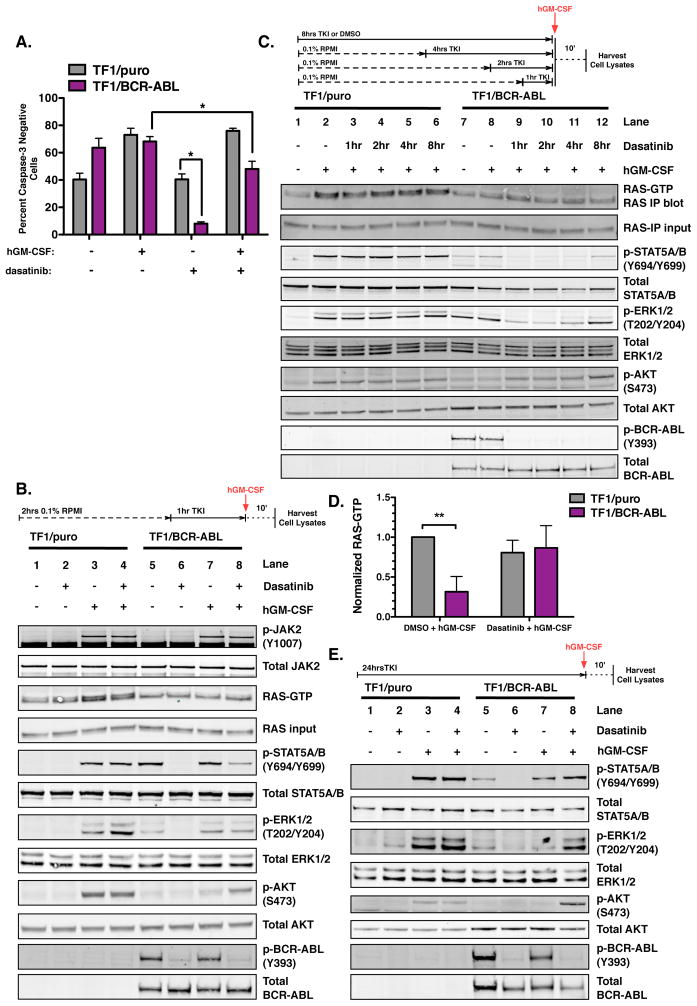
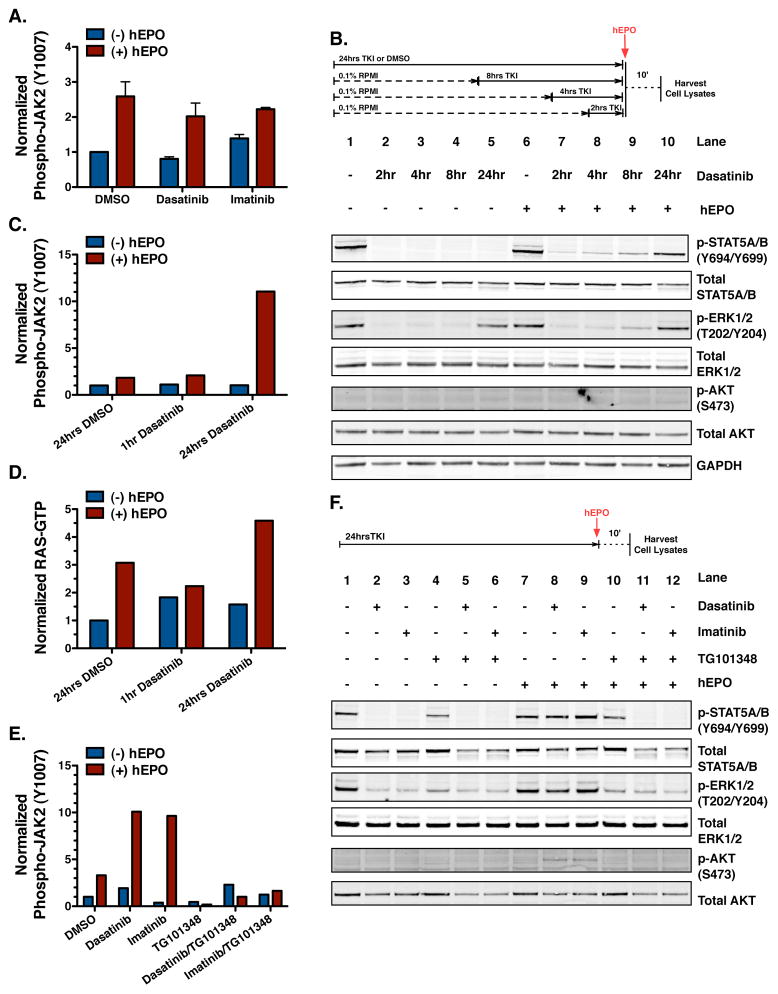
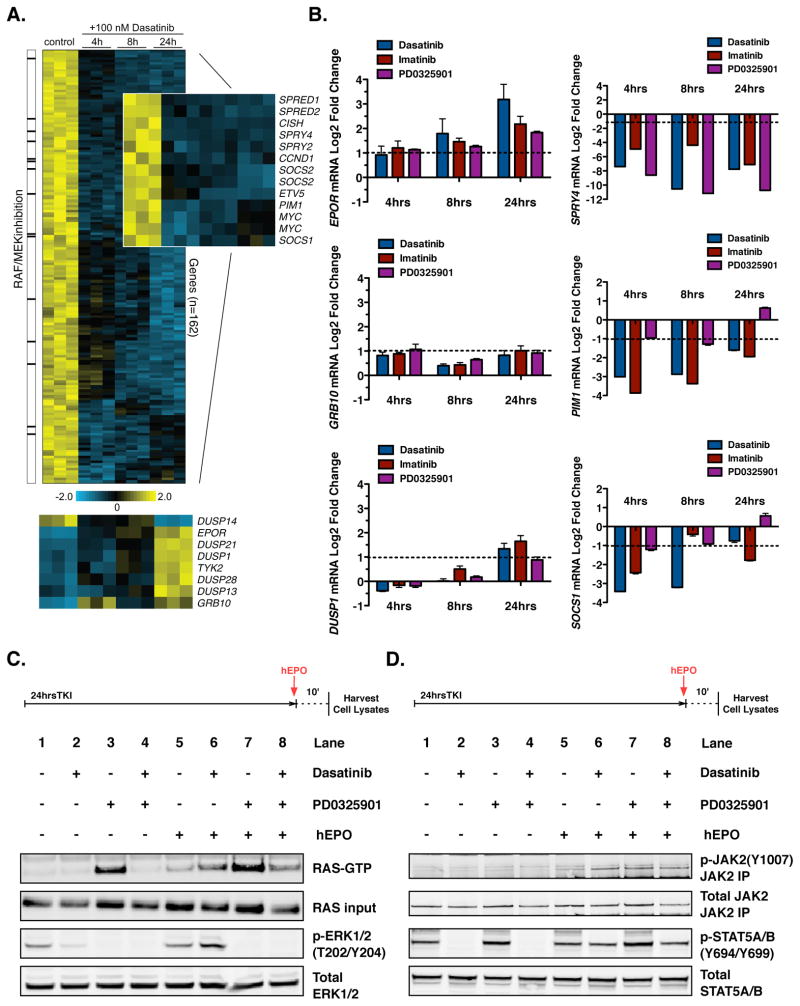
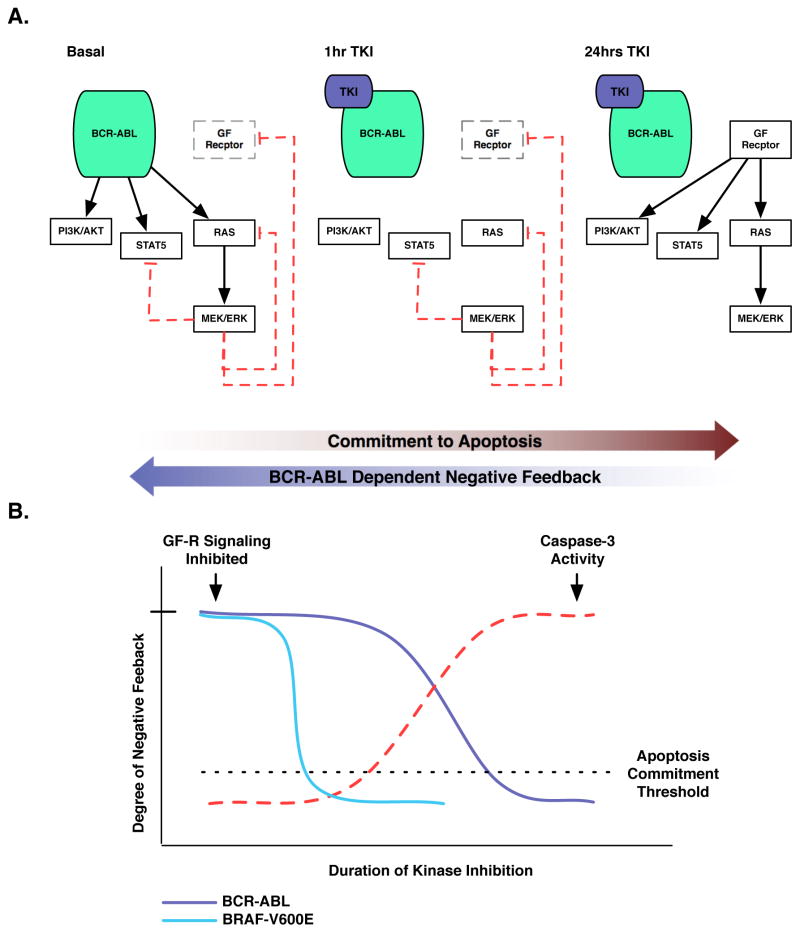
The clinical experience with BCR-ABL tyrosine kinase inhibitors (TKI) for the treatment of chronic myelogenous leukemia (CML) provides compelling evidence for oncogene addiction. Yet, the molecular basis of oncogene addiction remains elusive. Through unbiased quantitative phosphoproteomic analyses of CML cells transiently exposed to BCR-ABL TKI, we identified persistent downregulation of growth factor receptor (GF-R) signaling pathways. We then established and validated a tissue-relevant isogenic model of BCR-ABL-mediated addiction, and found evidence for myeloid GF-R signaling pathway rewiring that profoundly and persistently dampens physiologic pathway activation. We demonstrate that eventual restoration of ligand-mediated GF-R pathway activation is insufficient to fully rescue cells from a competing apoptotic fate. In contrast to previous work with BRAF(V600E) in melanoma cells, feedback inhibition following BCR-ABL TKI treatment is markedly prolonged, extending beyond the time required to initiate apoptosis. Mechanistically, BCR-ABL-mediated oncogene addiction is facilitated by persistent high levels of MAP-ERK kinase (MEK)-dependent negative feedback.

Significance: We found that BCR–ABL can confer addiction in vitro by rewiring myeloid GF-R signaling through establishment of MEK-dependent negative feedback. Our findings predict that deeper, more durable responses to targeted agents across a range of malignancies may be facilitated by maintaining negative feedback concurrently with oncoprotein inhibition.


Conflict of interest statement

Conflict of Interest Disclosure Statement

N.P. Shah has received funding for the conduct of clinical research from Bristol-Myers Squibb and Ariad Pharmaceuticals. N.P. Shah has served as an ad hoc consultant for Bristol-Myers Squibb and Ariad Pharmaceuticals.

Figures

Figure 1
Figure 1. Transient Exposure of CML Cell Lines to Dasatinib Results in Durable Dephosphorylation of Select Tyrosine Residues in Myeloid Growth-Factor Receptor Signaling Pathways
A. Schematic of SILAC-based quantitative phosphoproteomic analysis of global phosphotyrosine signaling in the K562 cells before and after a high-dose pulse (HDP) of dasatinib. K562 cells grown in “light” (non-isotope-containing) RPMI were treated with a 100nM dasatinib for 20 minutes, and cell lysates were generated before HDP (PRE), at the time of drug washout (EOE), and 3hr and 6hrs post-HDP (HDP3, HDP6). Equivalent lysates were generated from K562 cells grown in “heavy” (isotope-containing) RPMI. Light and heavy K562 cell lysates were mixed at a 1:1 ratio prior to phosphotyrosine peptide (PY100) enrichment, peptide fractionation, and MS/MS analysis. B. Heat map representation of persistent phosphorylation changes in myeloid growth factor receptor signaling pathways identified by bioinformatic functional analysis. Change in phosphorylation at each HDP time point was normalized to the “PRE” condition and are represented on a log2 - transformed scale. Gray areas designate “no data”. C. Western immunoblot analysis of select myeloid growth factor receptor signaling pathways in K562 and KU812 cells before and after a 100nM HDP of dasatinib. D. Heat map representation of BCR-ABL phosphorylation identified by phosphoproteomic analysis and western immunoblot analysis in K562 cells before and after a 100nM HDP of dasatinib. (ABL1a numbering).
Figure 2
Figure 2. BCR-ABL Kinase Activity Rewires GM-CSF Receptor Signaling and Confers Oncogene Addiction in TF1 Cells
A. Percent cleaved caspase-3 negative population (live cells) of TF1/puro and TF1/BCR-ABL cells following 48 hours of treatment with, 0.2% DMSO, 2ng/mL hGM-CSF, 100nM dasatinib or 100nM dasatinib supplemented with 2ng/mL of hGM-CSF. Active caspase-3 was measured by flow cytometry. Data represent average ± SD (n=3; *p<0.001; two-way ANOVA with Bonferroni post-tests). B. Upper: Line diagram representation of duration of serum starve, kinase inhibitor treatment, and growth-factor stimulation. Lower: Western immunoblot analysis of hGM-CSF-mediated (10′ stimulation) JAK2 activation, RAS-GTP loading, and activation of downstream effectors from whole cell lysates in TF1/puro and TF1/BCR-ABL cells treated for 1 hour with 100nM dasatinib. The activation status of JAK2 was determined by immunoprecipitation and activation loop phosphorylation (Y1007). RAS activation was monitored using a RAS-GTP pull-down assay. C. Upper: Line diagram representation of duration of serum starve, kinase inhibitor treatment, and growth-factor stimulation. Lower: Western immunoblot analysis of hGM-CSF-mediated (10′ stimulation) RAS-GTP loading and activation of downstream effectors in TF1/puro and TF1/BCR-ABL cells after short-term and extended dasatinib treatment (100nM: 1hr, 2hrs, 4hrs, 8hrs). RAS activity was monitored as in (B). D. Normalized RAS-GTP loading in hGM-CSF-stimulated (10′) TF1/puro and TF1/BCR-ABL cells after prolonged dasatinib treatment (100nM, 24hrs). RAS activity was monitored as in (B). RAS-GTP loading was normalized to the level observed in the “TF1/puro - DMSO+hGM-CSF” condition for each experimental replicate. Data represent the average + SD (n=3; **p < 0.01; two-way ANOVA with Bonferroni post-tests). E. Upper: Line diagram representation of duration of serum starve, kinase inhibitor treatment, and growth-factor stimulation. Lower: Western immunoblot analysis of whole cell lysates from TF1/puro and TF1/BCR-ABL cells after prolonged dasatinib treatment (100nM, 24hrs) and hGM-CSF stimulation (10′).
Figure 3
Figure 3. Erythropoietin Receptor-Mediated Activation of the JAK2/STAT5, RAS/MAPK, and PI3K/AKT Signaling Pathways is Attenuated by BCR-ABL Kinase Activity in K562 Cells
A. Normalized hEPO-mediated (10′ stimulation) JAK2 activation in K562 cells treated for 1hr with either 100nM dasatinib or 1μM imatinib. Data represents the average ± SD (n=3). JAK2 activation was monitored by immunoprecipitation and activation loop (Y1007) phosphorylation. JAK2 activation was normalized to the level of phospho-Y1007 observed in the “DMSO” condition for each experimental replicate. B. Upper: Line diagram representation of duration of serum starve, kinase inhibitor treatment, and growth-factor stimulation. Lower: Western immunoblot analysis of whole cell lysates from K562 cells after short-term and prolonged BCR-ABL inhibition (100nM dasatinib: 2hrs, 4hrs, 8hrs, 24hrs; 0.2% DMSO, 24hrs) followed by hEPO stimulation (10′). C. Normalized hEPO-mediated JAK2 activation in K562 cells after short-term (1hr) and prolonged (24hrs) 100nM dasatinib treatment followed hEPO stimulation (10′). Data is representative of triplicate experimental analysis. JAK2 activation and normalization was performed as in (A). D. Normalized RAS-GTP loading in K562 cells after short-term (1hr) and prolonged (24hrs) 100nM dasatinib treatment followed by hEPO stimulation (10′). Data is representative of triplicate experimental analysis. RAS activation was monitored using a RAS-GTP pulldown assay and RAS-GTP levels were normalized to the “DMSO” condition. E. Normalized hEPO-mediated (10′ stimulation) JAK2 activation in K562 cells pretreated for 24hrs with 0.2% DMSO, 100nM dasatinib, 1μM imatinib, 500nM TG101348, dasatinib/TG101348, or imatinib/TG101348. JAK2 activation was monitored and normalized as in (A). F. Upper: Line diagram representation of duration of serum starve, kinase inhibitor treatment, and growth-factor stimulation. Lower: Western immunoblot analysis of whole cell lysates in K562 cells pretreated for 24hrs with 0.2% DMSO, 100nM dasatinib, 1μM imatinib, 500nM TG101348, dasatinib/TG101348, or imatinib/TG101348 followed by hEPO stimulation (10′).
Figure 4
Figure 4. Global Gene Expression Analysis of Dasatinib Treated K562 Cells Identifies Candidate Mediators Responsible for the Attenuation of Myeloid GF-R Signaling in CML Cells
A. Heat map representation of the 162 genes significantly down-regulated after 4, 8, and 24 hours of dasatinib treatment in K562 cells. Heat map inset to the right highlights genes within this group that are associated with negative feedback of the RAS/MAPK and JAK/STAT signaling pathways, as well as the transcriptional output of ERK. The column to the left denotes genes previously reported to be involved in the negative feedback network of BRAFV600E expressing cells (6, 25). The heat map at the bottom highlights a few of the genes with increased expression following dasatinib treatment in K562 cells. B. Quantitative PCR (qPCR) analysis of potential negative feedback genes in K562 cells treated with dasatinib (100nM), imatinib (1μM), or PD0325901 (500nM). The average fold expression change (2(−ΔΔCt)) and standard deviation (SDfold-change) for each gene is represented (n=3). C. Upper: Line diagram representation of duration of serum starve, kinase inhibitor treatment, and growth-factor stimulation. Lower: Western immunoblot analysis of RAS and ERK activity before and after hEPO-stimulation (10′) in K562 cells pretreated for 24hrs with 0.2% DMSO, 100nM dasatinib, 500nM PD0325901, or dasatinib/PD0325901. RAS activity was monitored using a RAS-GTP pulldown assay. D. Upper: Line diagram representation of duration of serum starve, kinase inhibitor treatment, and growth-factor stimulation. Lower: Western immunoblot analysis of JAK2 and STAT5 activity before and after hEPO-stimulation in K562 cells treated under the same experimental conditions as (A). JAK2 activation was determined by immunoprecipitation and activation loop (Y1007) phosphorylation.
Figure 5
Figure 5. Caspase-3 Activity is Detected in Dasatinib Treated K562 Cells Prior to Complete Relief of Negative Feedback
A. Western immunoblot assessment of cleaved caspase-3 in whole cell lysates from K562 cells treated with 100nM dasatinib for 4hrs, 8hrs, 12hrs, and 24hrs. B. Representation of a single gold nanosensor intensity trace as a function of time. Intact nanosensor yields a high scattering intensity, while cutting event mediated by caspase-3 is observed as an intensity drop due to loss in plasmon coupling (21, 32, 33). C. Representative darkfield images of nanosensors before and after exposure to cell lysates from K562 cells treated with vehicle (DMSO) or 100nM dasatinib. D. Total normalized nanosensor cutting events observed in K562 cell lysates treated with vehicle (DMSO) and 100 nM dasatinib. Treatment of lysates with the caspase-3 inhibitor z-DEVD-cmk is shown as a control.
Figure 6
Figure 6. BCR-ABL-Dependent Negative Feedback Differs from BRAFV600E, FLT3-ITD, and FLT3-D835V in TF1 Cells
A. Growth curves of TF1 GFP-positive cells expressing BCR-ABL, BRAFV600E, FLT3-ITD, or FLT3-D835V. Cell growth in the presence of 2ng/mL hGM-CSF was monitored for 13 days. Data represents the average ± SD (n=3; *p<0.001 for p210 vs. FLT3-ITD and FLT3-D835V on day 13, **p<0.001 for MIG vs. all other cell lines on day 13. Two-way ANOVA with Bonferroni post-tests). B. Percent cleaved caspase-3 negative population (live cells) of TF1/puro and TF1/FLT3-ITD cells following 48 hours of treatment with 2ng/mL hGM-CSF, 10nM AC220, 0.2% DMSO, or 10nM AC220 supplemented with 2ng/mL of hGM-CSF. Active caspase-3 was measured by flow cytometry. Data represent average ± SD (n=3: *p<0.001; two-way ANOVA with Bonferroni post-tests). C. Western immunoblot analysis of TF1/puro and TF1/FLT3-ITD whole cell lysates following prolonged FLT3-ITD inhibition (10nM AC220: 2hrs, 4hrs, 8hrs, 24hrs; 0.2% DMSO, 24 hours) and hGM-CSF stimulation (10′).
Figure 7
Figure 7. Model of BCR-ABL-Mediated Oncogene Addiction
A. Schematic representation of BCR-ABL-mediated oncogene addiction. BCR-ABL expressing cells initiate and commit to apoptosis prior to the complete relief of MEK-dependent negative feedback at the level of GF-R signaling. B. Schematic comparison of the kinetics of apoptosis induction (red dashed line) and loss of negative feedback in BRAFV600E-expressing melanoma cells (cyan solid line) and BCR-ABL-expressing CML cells (blue solid line).

Similar articles

Cited by

References

    1. Gorre ME, Mohammed M, Ellwood K, Hsu N, Paquette R, Rao PN, et al. Clinical resistance to STI-571 cancer therapy caused by BCR-ABL gene mutation or amplification. Science. 2001;293:876–80. - PubMed
    1. Druker BJ, Sawyers CL, Kantarjian H, Resta DJ, Reese SF, Ford JM, et al. Activity of a specific inhibitor of the BCR-ABL tyrosine kinase in the blast crisis of chronic myeloid leukemia and acute lymphoblastic leukemia with the Philadelphia chromosome. N Engl J Med. 2001;344:1038–42. - PubMed
    1. Sharma SV, Gajowniczek P, Way IP, Lee DY, Jiang J, Yuza Y, et al. A common signaling cascade may underlie “addiction” to the Src, BCR-ABL, and EGF receptor oncogenes. Cancer Cell. 2006;10:425–35. - PMC - PubMed
    1. Flaherty KT, Puzanov I, Kim KB, Ribas A, McArthur GA, Sosman JA, et al. Inhibition of mutated, activated BRAF in metastatic melanoma. N Engl J Med. 363:809–19. - PMC - PubMed
    1. Solit DB, Garraway LA, Pratilas CA, Sawai A, Getz G, Basso A, et al. BRAF mutation predicts sensitivity to MEK inhibition. Nature. 2006;439:358–62. - PMC - PubMed

Publication types

MeSH terms