. 2014 Jan:185:58-69.
doi: 10.1016/j.bpc.2013.11.002. Epub 2013 Nov 13.

ATPγS competes with ATP for binding at Domain 1 but not Domain 2 during ClpA catalyzed polypeptide translocation

Affiliations

ATPγS competes with ATP for binding at Domain 1 but not Domain 2 during ClpA catalyzed polypeptide translocation

Justin M Miller et al. Biophys Chem. 2014 Jan.

Abstract

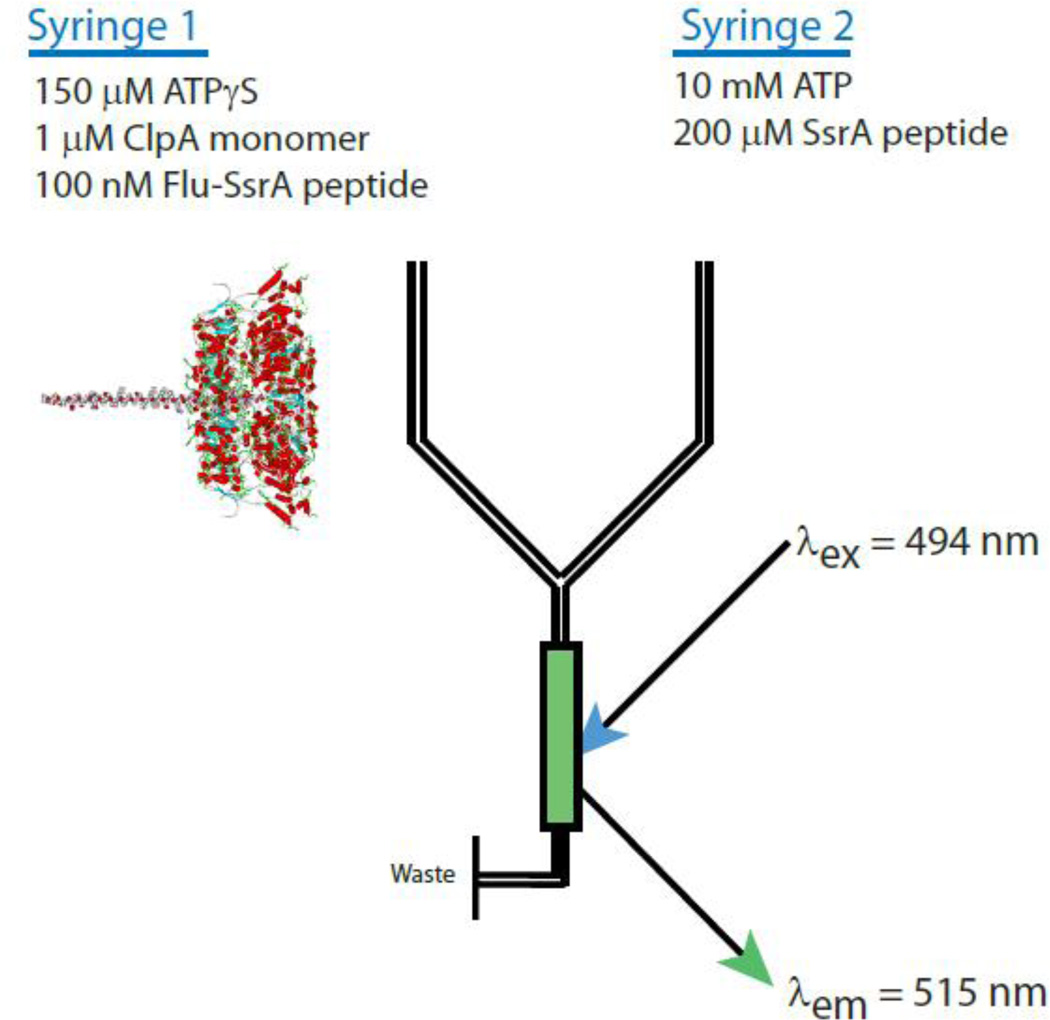
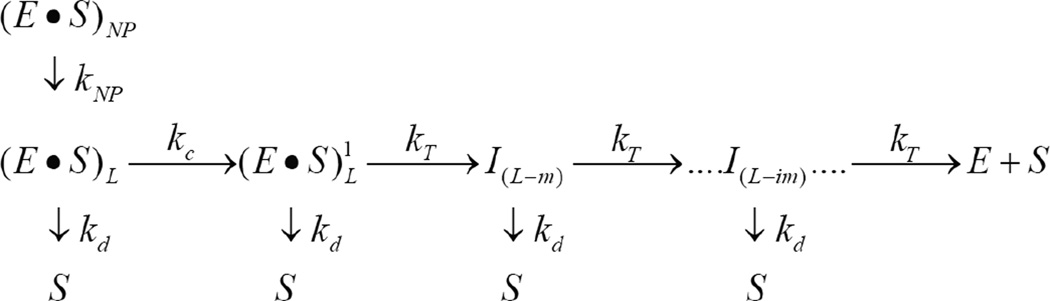
ClpAP is an ATP-dependent protease that assembles through the association of hexameric rings of ClpA with the cylindrically-shaped protease ClpP. ClpA contains two nucleotide binding domains, termed Domain 1 (D1) or 2 (D2). We have proposed that D1 or D2 limits the rate of ClpA catalyzed polypeptide translocation when ClpP is either absent or present, respectively. Here we show that the rate of ClpA catalyzed polypeptide translocation depends on [ATPγS] in the absence of ClpP, but not in the presence of ClpP. We observe that ATPγS non-cooperatively binds to ClpA during polypeptide translocation with an apparent affinity of ~6 μM, but that introduction of ClpP shifts this affinity such that translocation is not affected. Interpreting these data with our proposed model for translocation catalyzed by ClpA vs. ClpAP suggests that ATPγS competes for binding at D1 but not at D2.

Keywords: AAA+ motor proteins; ATP dependent proteases; Pre-steady-state kinetics; Protein unfoldases; Steady-state kinetics.


Figures

Fig. 1
Fig. 1
Schematic representation of single turnover stopped-flow translocation experiments. Syringe 1 contains the indicated reagents, ClpA, ATPγS, and fluorescein-labeled polypeptide. The structure schematizes the contents of syringe 1 with ClpA hexamers bound by a single polypeptide. Syringe 2 contains 10 mM ATP and 200 µM SsrA peptide to serve as a trap for unbound ClpA or any ClpA that dissociates from polypeptide during the course of the reaction. The two reactants are rapidly mixed in the green colored chamber and fluorescein is excited at λex 494 nm. Fluorescein emission is observed above 515 nm with a 515 nm long pass filter. Upon mixing, the concentrations are two-fold lower than in the preincubation syringe.
Fig. 2
Fig. 2
ClpA catalyzes ATPγS hydrolysis. a) Steady-state kinetic experiments were performed by mixing 10 µM ClpA monomer with ATPγS supplemented with 35S-ATPγS. The relationship between initial velocity and nucleotide concentration was subjected to NLLS analysis using Eq. (1) to obtain estimates of the Michaelis constant, Km = (134 ± 46) µM, and the turnover number,SD= (0.05 ± 0.004) min−1. b) Two fluorescence time courses are shown that have been collected using the experimental design schematized in Fig. 1. ClpA has been allowed to incubate in the presence of 5 mM ATPγS and 100 nM fluorescein-labeled polypeptide for either ~15 (solid blue circles) or ~70 minutes (solid red circles) before mixing with ATP and SsrA peptide (pre-mixing concentrations).
Fig. 3
Fig. 3
Fluorescence time-courses for ClpA catalyzed polypeptide translocation. As shown in Fig. 1, 1 µM ClpA was pre-assembled in the presence of ATPγS and 100 nM fluorescein-labeled polypeptide substrate prior to rapidly mixing with 10 mM ATP and 200 µM SsrA. Time courses are shown for ClpA catalyzed polypeptide translocation of N-Cys-50, N-Cys-40, and N-Cys-30 (see Table 1) substrates after incubation of ClpA with 75 µM (green circles), 600 µM (blue circles), and 2.5 mM (red circles) ATPγS. The time courses shown illustrate that the extent of the lag phase is dependent upon [ATPγS]. The solid black lines represent a global NLLS fit using Scheme 1 for time-courses collected with substrates I - III in Table 1. The resulting kinetic parameters are summarized in Table 2 for each [ATPγS]. Each time-course was analyzed under a given set of conditions by constraining the parameters kT, kC, kNP, and h to be global parameters, while Ax, x, and n were allowed to float for each polypeptide length.
Fig. 4
Fig. 4
Molecular mechanism for ClpA catalyzed polypeptide translocation depends on [ATPγS]. a) Dependence of mkT on [ATPγS] for ClpA catalyzed polypeptide translocation in the absence of ClpP, where the solid line is the result of a NLLS fit to Eq. (5) with KATPγS= (160 ± 7) × 103 M−1 and mkT,max = 21.6 ± 0.2 aa s−1. The number of ATP and ATPγS binding sites, v = 2.5 and ω = 1.0, respectively, the association equilibrium constant, KATP = 1.9 × 10³ M−1, and [ATP] = 5 mM were treated as constant parameters in this analysis. b) The dependence of kT on [ATPγS] was subjected to NLLS analysis using Eq. (5), where the solid line represents the best fit with Katp^s = (104 ± 13) x 103 M−1 and kT,max = (1.39 ± 0.05) s−1. For this analysis, the number of ATP and ATPγS binding sites, v = 2.2 and ω = 1.0, respectively, the association equilibrium constant, Katp = 1.8 × 10³ M−1 and [ATP] = 5 mM were treated as constant parameters. c) Dependence of the kinetic step-size on [ATPγS], solid line represents the average of six measurements, <m> = (16.3 ± 0.5) aa step−1. (d) The rate of translocation for ClpA catalyzed polypeptide translocation in the presence of ClpP, mkT, does not exhibit any dependence on ATPγS concentration with a mean mkT = (32 ± 2) aa s−1, where the solid line represents the average of five measurements. (e-f) The elementary rate constant and kinetic step-size for ClpA catalyzed polypeptide translocation in the presence of ClpP do not exhibit a significant dependence on [ATPγS].
Fig. 5
Fig. 5
Parameter correlation between the kinetic step-size and elementary rate constant depends on [ATPγS] for ClpA catalyzed polypeptide translocation in the absence of ClpP. (a) Plot of the translocation rate constant versus the kinetic step-size from two representative Monte Carlo simulations from polypeptide translocation experiments collected in the presence of 75 µM (blue spheres) and 2.5 mM (red spheres) ATPγS. Lines represent linear least-squares fit of 75 µM (solid blue line) and 2.5 mM (dashed red line) ATPγS data, where the 75 µM data exhibit a slope of −0.096 ± 0.001 and the 2.5 mM data exhibit a slope of −0.0148 ± 0.0005. (b,c) Plots of the sums of the squared residuals as functions of fixed values of the kinetic step-size (b) or fixed values for the elementary rate constant (c) for conditions of 75 µM (solid blue line) and 2.5 mM (dashed red line) ATPγS. From the minima shown in Fig. 5b, the best estimate of the kinetic step-size is m = 16.2 or 27.8 aa step−1, for 75 µM or 2.5 mM ATPγS, respectively. For the elementary translocation rate constant, the best estimate from the minima shown in Fig. 5c is 1.2 s−1 or 0.4 s−1 for 75 µM or 2.5 mM ATPγS, respectively.
Fig. 6
Fig. 6
Parameter correlation between the kinetic step-size and elementary rate constant depends on [ATPγS] for ClpA catalyzed polypeptide translocation in the presence of ClpP. (a) Plot of the translocation rate constant versus the kinetic step-size from two representative Monte Carlo simulations from polypeptide translocation experiments collected in the presence of 75 µM (blue spheres) and 1 mM (red spheres) ATPγS. Solid or dashed lines represent linear least-squares fit of 75 µM (solid blue line) and 1 mM (dashed red line) ATPγS data, where the 75 µM data exhibit a slope of −0.97 ± 0.01 and the 1 mM data exhibit a slope of −0.258 ± 0.004. (b,c) Plots of the sums of the squared residuals as functions of fixed values of the kinetic step-size (b) or fixed values for the elementary rate constant (c) for conditions of 75 µM (solid blue line) and 1 mM (dashed red line) ATPγS. From the minima shown in Fig. 6 b, the best estimate of the kinetic step-size is m = 4.8 or 11.2 aa step−1, for 75 µM or 1 mM ATPγS, respectively. For the elementary translocation rate constant, the best estimate from the minima shown in Fig. 6 c is 5.9 s−1 or 2.7 s−1 for 75 µM or1 mM ATPγS, respectively.
Scheme 1
Scheme 1
Sequential n-step model for polypeptide translocation. (E -S)L and (E S)NP represent enzyme bound to polypeptide substrate in the productive and nonproductive forms, respectively, and S is the unbound polypeptide substrate. kT is the translocation rate constant, kd is the dissociation rate constant, L is the polypeptide length, m is the average distance translocated between two rate limiting steps with rate constant kT, ‘i’ in I(L-im) represents i number of translocation steps, and the step that occurs with rate constant kc represents a step slower than the step with rate constant kT. 1. Schirmer, E. C., Glover, J. R., Singer, M. A. & Lindquist, S. (1996). HSP100/Clp proteins: a common mechanism explains diverse functions. Trends Biochem Sci 21, 289–96.

Similar articles

Cited by

References

    1. Alberts B. The cell as a collection of protein machines: preparing the next generation of molecular biologists. Cell. 1998;92:291–294. - PubMed
    1. Neuwald AF, Aravind L, Spouge JL, Koonin EV. AAA+: A class of chaperone-like ATPases associated with the assembly, operation, and disassembly of protein complexes. Genome Res. 1999;9:27–43. - PubMed
    1. Karzai AW, Roche ED, Sauer RT. The SsrA-SmpB system for protein tagging, directed degradation and ribosome rescue. Nat Struct Biol. 2000;7:449–455. - PubMed
    1. Gottesman S. Proteases and their targets in Escherichia coli. Annu Rev Genet. 1996;30:465–506. - PubMed
    1. Sauer RT, Baker TA. AAA+ Proteases: ATP-Fueled Machines of Protein Destruction. Annual review of biochemistry. 2011;80:587–612. - PubMed

Publication types

MeSH terms

LinkOut - more resources