. 2014 Jan;20(1):47-53.
doi: 10.1038/nm.3424. Epub 2013 Dec 22.

Host-cell sensors for Plasmodium activate innate immunity against liver-stage infection

Affiliations

Host-cell sensors for Plasmodium activate innate immunity against liver-stage infection

Peter Liehl et al. Nat Med. 2014 Jan.

Abstract

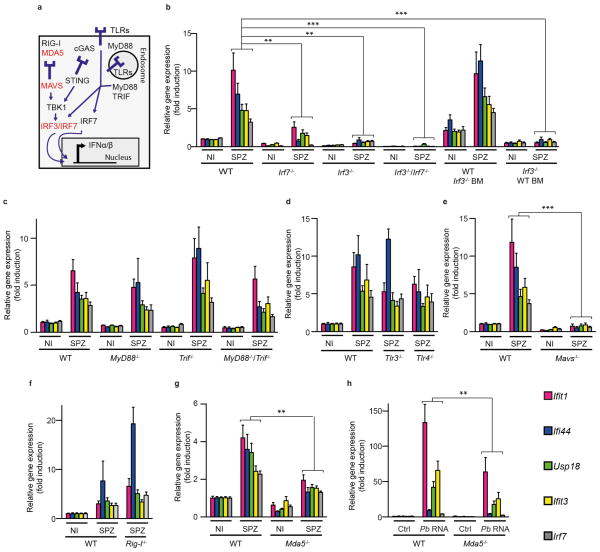
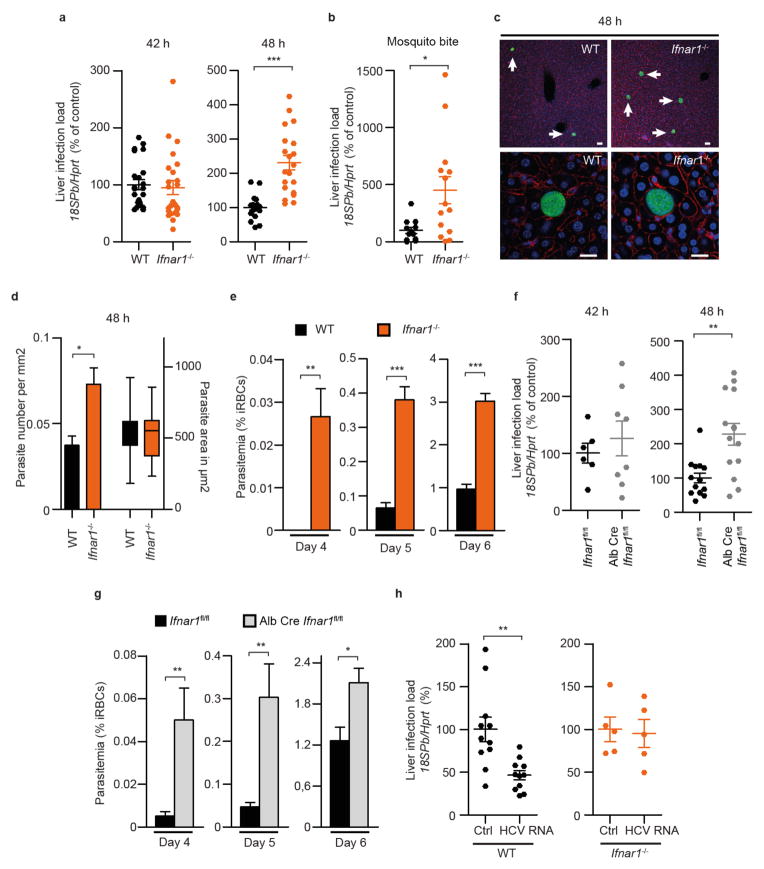
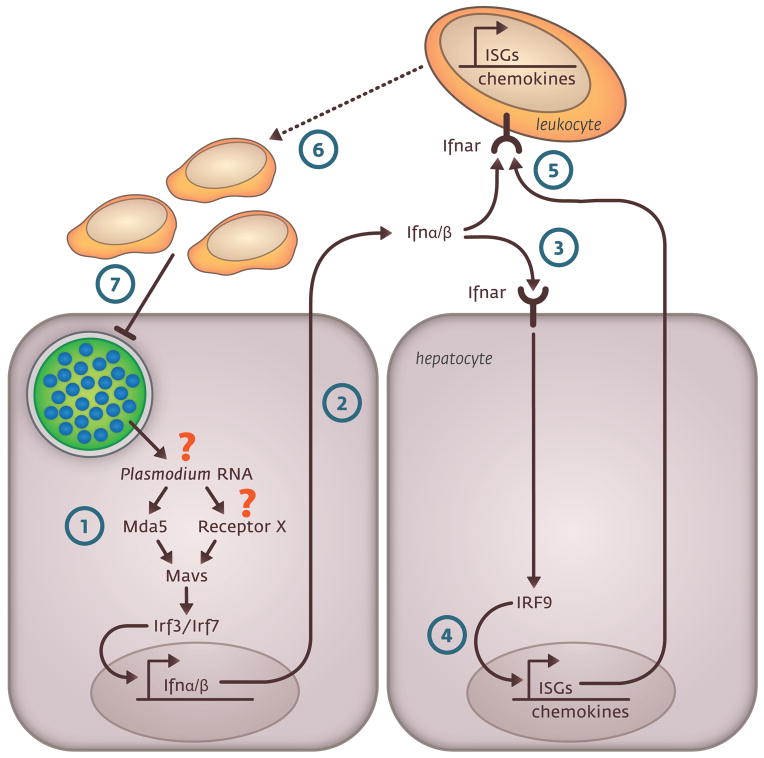
Before they infect red blood cells and cause malaria, Plasmodium parasites undergo an obligate and clinically silent expansion phase in the liver that is supposedly undetected by the host. Here, we demonstrate the engagement of a type I interferon (IFN) response during Plasmodium replication in the liver. We identified Plasmodium RNA as a previously unrecognized pathogen-associated molecular pattern (PAMP) capable of activating a type I IFN response via the cytosolic pattern recognition receptor Mda5. This response, initiated by liver-resident cells through the adaptor molecule for cytosolic RNA sensors, Mavs, and the transcription factors Irf3 and Irf7, is propagated by hepatocytes in an interferon-α/β receptor-dependent manner. This signaling pathway is critical for immune cell-mediated host resistance to liver-stage Plasmodium infection, which we find can be primed with other PAMPs, including hepatitis C virus RNA. Together, our results show that the liver has sensor mechanisms for Plasmodium that mediate a functional antiparasite response driven by type I IFN.


Conflict of interest statement

COMPETING FINANCIAL INTERESTS

The authors declare no competing financial interests.

Figures

Figure 1
Figure 1
Plasmodium liver-stage infection induces a type I IFN response. (a) Heatmap showing differentially expressed transcripts in livers of WT and Ifnar1−/− mice 40 h after infection with 5 × 10⁴ P. berghei ANKA (Pb) sporozoites (SPZ). Noninfected control mice, were injected with an equivalent amount of noninfected salivary gland extract NI (Sg). Columns represent individual mice, and rows represent differentially expressed genes in P. berghei–infected WT mice compared to NI animals (P < 0.05). (b) Mean gene expression values in mice after infection with P. berghei sporozoites and in NI (Sg) control mice. Color identifies genes with more than twofold variation in WT infected mice (P < 0.05). Red: induced genes; Blue: repressed genes. (c) Expression profile of 5 representative ISGs in livers of WT and Ifnar1−/− mice 42 h after infection. (d,e) ISGs expression in livers of WT mice 42 h after infection by injection with the indicated numbers of live, heat-inactivated or irradiated P. berghei sporozoites (d) or by mosquito bite with 10 or 25 P. berghei-infected mosquitos per mouse (e). (f) ISG expression in livers of WT mice at multiple time points after infection with P. berghei. (g,h) ISG expression in the livers of WT and Ifnar1−/− mice infected with P. yoelii 17XNL (Py) sporozoites (g) and C57BL/6 and BALB/c mice infected with P. berghei sporozoites (h), 42 h after infection. (i) ISG expression in livers of Ifnar1flox/flox, LysM-Cre-Ifnar1flox/flox and Alb-Cre-Ifnar1flox/flox mice after infection with P. berghei sporozoites. The least significant P value is shown, *P < 0.05; **P < 0.01; ***P < 0.001. Complete statistics in Supplementary Table 2. Data are expressed as means ± s.e.m.
Figure 2
Figure 2
Plasmodium-mediated type I IFN induction requires Mavs, and Mda5 senses Plasmodium RNA. (a) Schematic representation of type I IFN signaling pathways leading to the induction of IFN-α and IFN-β (IFN-α/β) transcription. The receptor cGAS (cyclic GMP-AMP synthase) is a cytoplasmic nucleotidyl transferase, which upon interaction with DNA synthesizes a dinucleotide molecule that in turn binds to and activates STING. (b) Gene expression analysis of 5 representative ISGs in livers of WT, Irf7−/−, Irf3−/− and Irf7−/−; Irf3−/− mice as well as bone marrow (BM)-chimeric mice (WT mice with Irf3−/− BM and Irf3−/− mice with WT BM 42 h after infection with 5 × 10⁴ P. berghei sporozoites. (cg) Gene expression analysis of 5 representative ISGs in livers of WT, Myd88−/−, Trif−/− and Myd88−/−/Trif−/− (c), Tlr3−/− and Tlr4−/− (d), Mavs−/− (e) Ddx58−/− (lacking Rig-I) (f) and Mda5−/− (g) mice 42 h after infection with 5 × 10⁴ P. berghei sporozoites (c–g). Statistical analysis was performed for each individual gene; the least significant P value is shown, *P < 0.05. (h) ISG expression in livers of WT and Mda5−/− mice 4 h after hydrodynamic injection with 50 μg per mouse of P. berghei RNA. Expression of individual genes from sporozoite-infected livers was tested against mock-injected control samples. The least significant P value of all samples is shown, **P < 0.01. Complete statistics in Supplementary Table 2. Data are expressed as means ± s.e.m.
Figure 3
Figure 3
The type I IFN response is required for in vivo host defense. (a) Parasite liver load in WT and Ifnar1−/− mice measured by qRT-PCR of P. berghei 18S rRNA, 42 h and 48 h after infection normalized to hypoxanthine-guanine phosphoribosyltransferase (Hprt) and plotted as percentage of the levels in WT mice. (b) Parasite liver load in WT and Ifnar1−/− mice 50 h after infection by mosquito bite using 10 mosquitos per mouse and plotted as percentage of the levels in WT mice. (c) Representative fluorescence images of liver sections of WT and Ifnar1−/− mice, 48 h after infection with GFP-expressing P. berghei sporozoites; parasite in green, DNA stained with DAPI (blue) and F-actin with phalloidin Alexa555 (red); arrows indicate parasite EEFs. Top scale bars, 40 μm; bottom scale bars, 20 μm. (d) EEF size (area) and density (number) in WT and Ifnar1−/− mice, analyzed by microscopy 48 h after infection with P. berghei sporozoites. (e) Parasitemia in WT and Ifnar1−/− mice after infection with 500 sporozoites. iRBCs stands for infected red blood cells. (f) Parasite liver load in Ifnar1flox/flox and Alb-Cre-Ifnar1flox/flox mice, as measured by qRT-PCR, 42 h and 48 h after infection with 5 × 10⁴ P. berghei sporozoites and plotted as percentage of the levels in Ifnar1flox/flox WT mice. (g) Parasitemia in Ifnar1flox/flox and Alb-Cre-Ifnar1flox/flox mice after infection with 500 P. berghei sporozoites. (h) Parasite liver load in WT and Ifnar1−/− mice treated with HCV RNA (50 μg per mouse, 20 h before infection), as measured by qRT-PCR, 42 h after infection with P. berghei sporozoites. Complete statistics in Supplementary Table 2. Data are expressed as means ± s.e.m.
Figure 4
Figure 4
Liver leukocytes responding to type I IFN are recruited to infected hepatocytes and are critical in parasite elimination. (a) Parasite liver load in WT and Ifnar1−/− mice treated with DMXAA (500 μg per mouse, 20 h before infection), as measured by qRT-PCR, 42 h after infection with P. berghei sporozoites and plotted as percentage of mock-treated mice. (b) Parasite load in primary hepatocytes treated with DMXAA (100 μg ml−1, 3 h before infection), as measured by qRT-PCR, 44 h after infection with P. berghei sporozoites and plotted as percentage of mock-treated cells. (c) Immunofluorescence staining of a liver section showing infected hepatocyte surrounded by immune cells 44 h after infection with P. berghei sporozoites. Parasite in green, DNA stained with DAPI (blue) and F-actin with phalloidin Alexa555 (red); arrow indicates infiltrating immune cells. Scale bar, 20 μm. (d) Percentage of EEFs associated with inflammatory foci in WT and Ifnar1−/− mice (n = 3) 44, 48 and 52 h after infection. Statistically significant differences were calculated using the Chi-squared test. (e) Gene expression analysis of 5 representative ISGs in isolated hepatocytes and liver leukocytes 42 and 48 h after infection with P. berghei sporozoites. The least significant P value is shown, *P < 0.05. (f) Percentage of EEFs associated with inflammatory foci in Ifnar1flox/flox and LysM-Cre-Ifnar1flox/flox mice (n = 3) 48 and 52 h after infection. Statistically significant differences were calculated using the Chi-squared test. (g) Parasite liver load in Ifnar1flox/flox and LysM-Cre-Ifnar1flox/flox mice measured by qRT-PCR, 42 and 48 h after infection with P. berghei sporozoites and plotted as percentage of the levels in WT mice. Complete statistics in Supplementary Table 2. Data are expressed as means ± s.e.m.
Figure 5
Figure 5
Schematic representation of the proposed sequence of events occurring in the liver after Plasmodium infection. Infection of hepatocytes by Plasmodium parasites induces a type I IFN response, which is triggered in liver-resident cells by Plasmodium RNA via the cytoplasmic RNA sensor Mda5 and other unknown receptors, Mavs and the transcription factors Irf3 and Irf7 (1). Type I IFNs are then released in the extracellular environment (2). It binds to Ifnar on the surface of hepatocytes, propagating the response in an autocrine and paracrine manner (3). In turn, Ifnar activation leads to the upregulation of ISG transcription (including chemokines) and propagation of the response throughout the entire liver (4). IFN and the chemokines released from hepatocytes activate (5) and direct (6) innate immune cells to the infected hepatocytes, which have a key role in parasite elimination (7).

Comment in

References

    1. malERA Consultative Group on Basic Science and Enabling Technologies. A research agenda for malaria eradication: basic science and enabling technologies. PLoS Med. 2011;8:e1000399. - PMC - PubMed
    1. Prudêncio M, Rodriguez A, Mota MM. The silent path to thousands of merozoites: the Plasmodium liver stage. Nat Rev Microbiol. 2006;4:849–856. - PubMed
    1. Pamplona A, Hanscheid T, Epiphanio S, Mota MM, Vigario AM. Cerebral malaria and the hemolysis/methemoglobin/heme hypothesis: shedding new light on an old disease. Int J Biochem Cell Biol. 2009;41:711–716. - PubMed
    1. Lang KS, et al. Immunoprivileged status of the liver is controlled by Toll-like receptor 3 signaling. J Clin Invest. 2006;116:2456–2463. - PMC - PubMed
    1. Liehl P, Mota MM. Innate recognition of malarial parasites by mammalian hosts. Int J Parasitol. 2012;42:557–566. - PubMed

Publication types

MeSH terms