

Non-raft adenylyl cyclase 2 defines a cAMP signaling compartment that selectively regulates IL-6 expression in airway smooth muscle cells: differential regulation of gene expression by AC isoforms
- PMID: 24363043
- PMCID: PMC8297510
- DOI: 10.1007/s00210-013-0950-4
Non-raft adenylyl cyclase 2 defines a cAMP signaling compartment that selectively regulates IL-6 expression in airway smooth muscle cells: differential regulation of gene expression by AC isoforms
Abstract
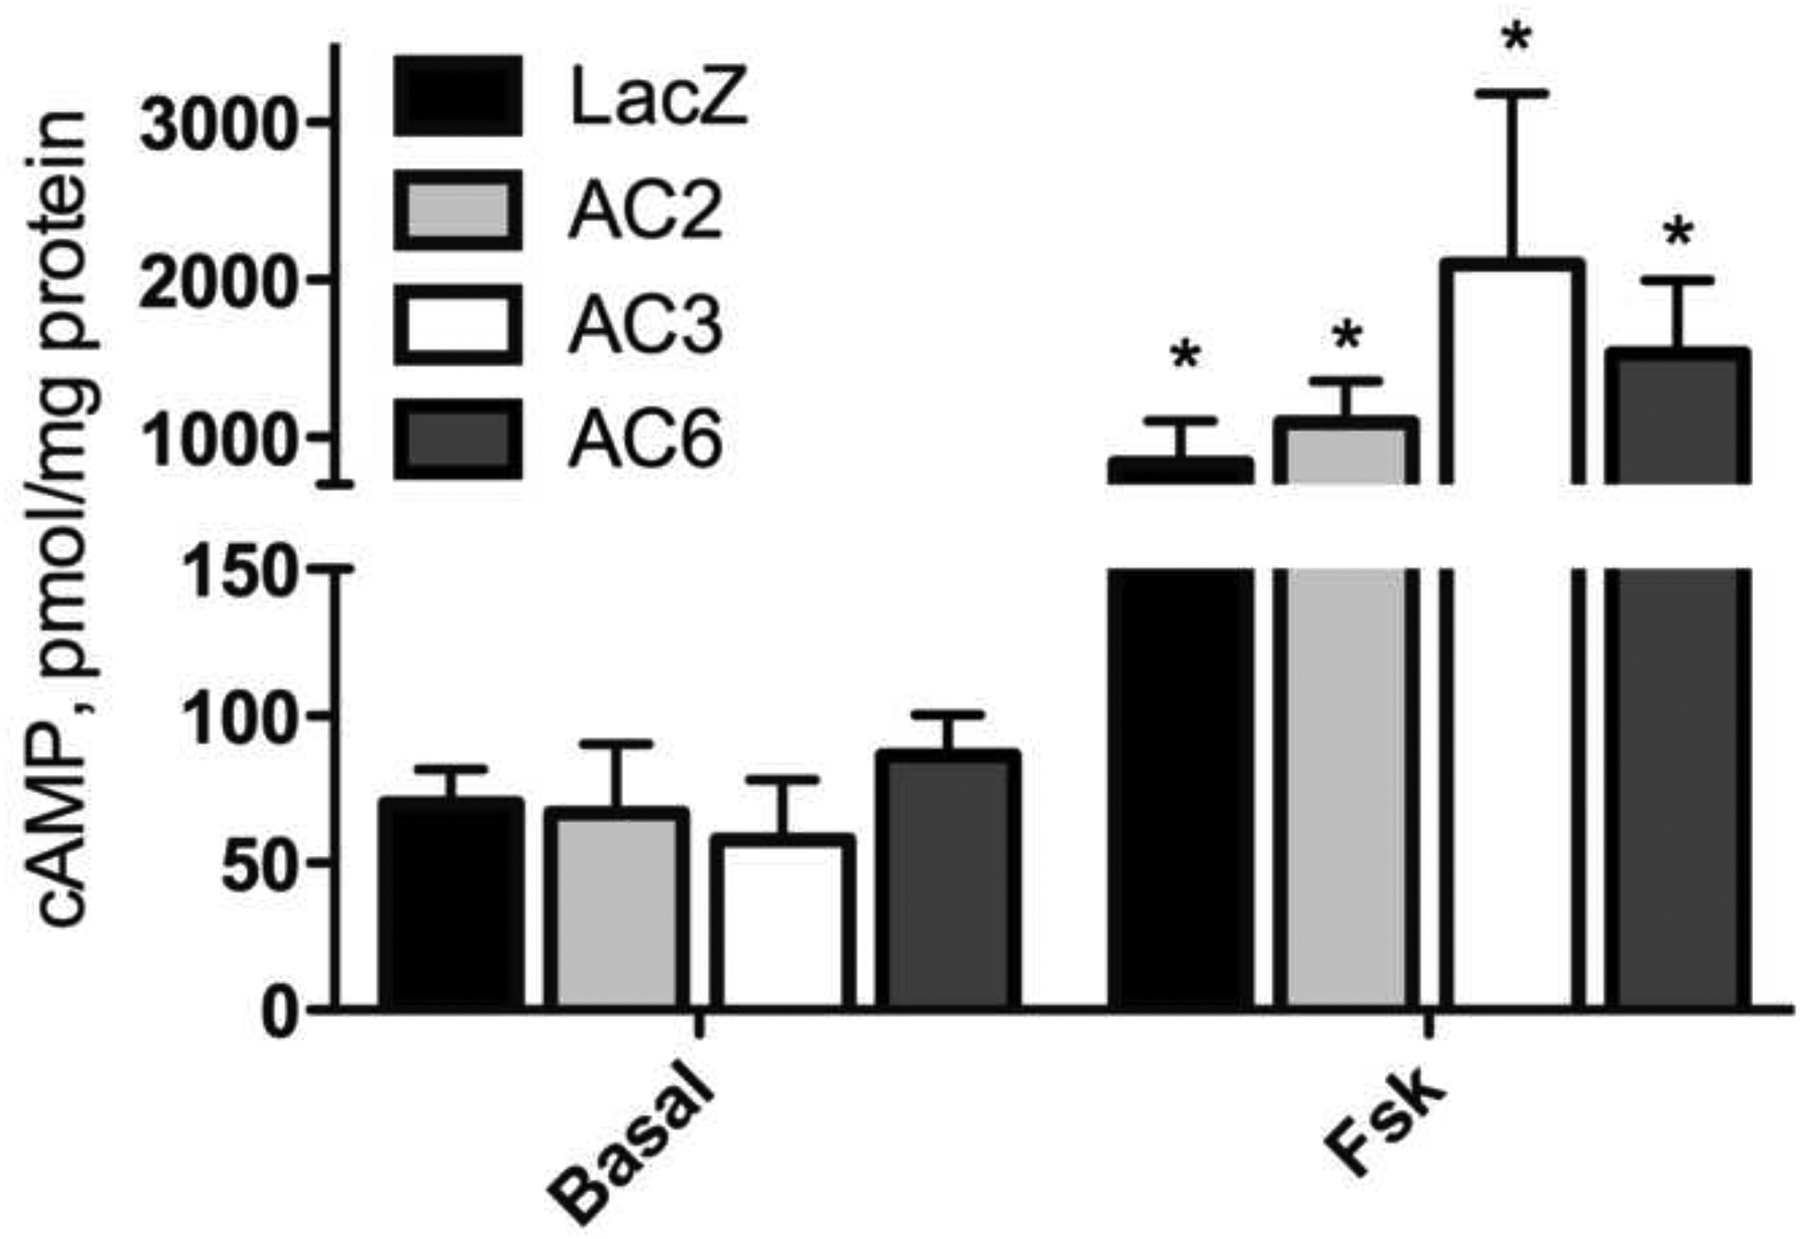
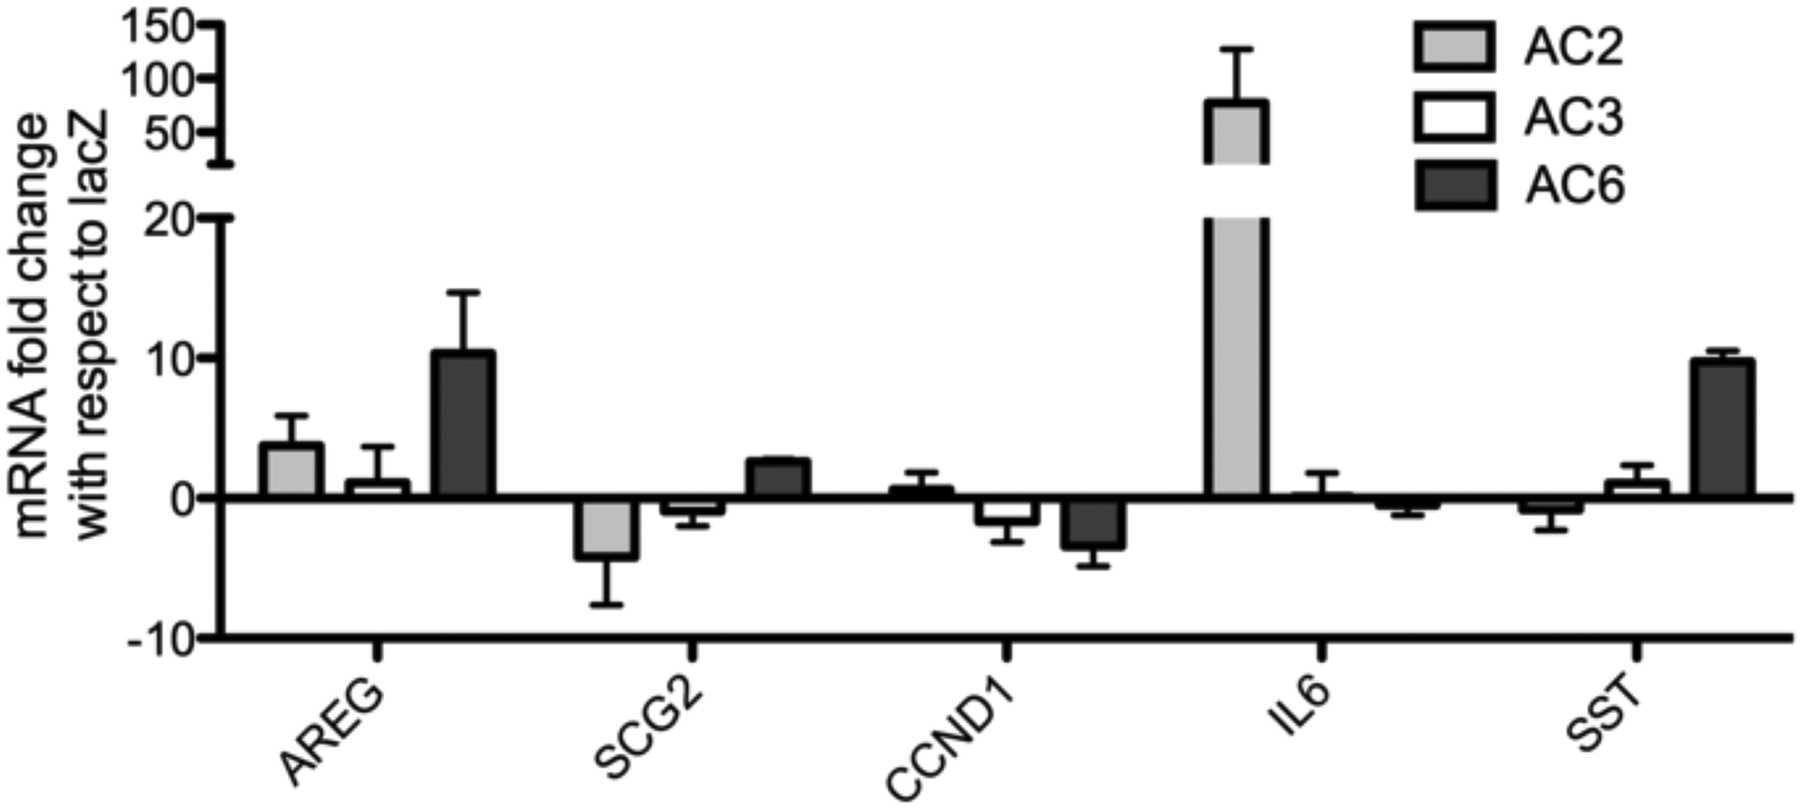
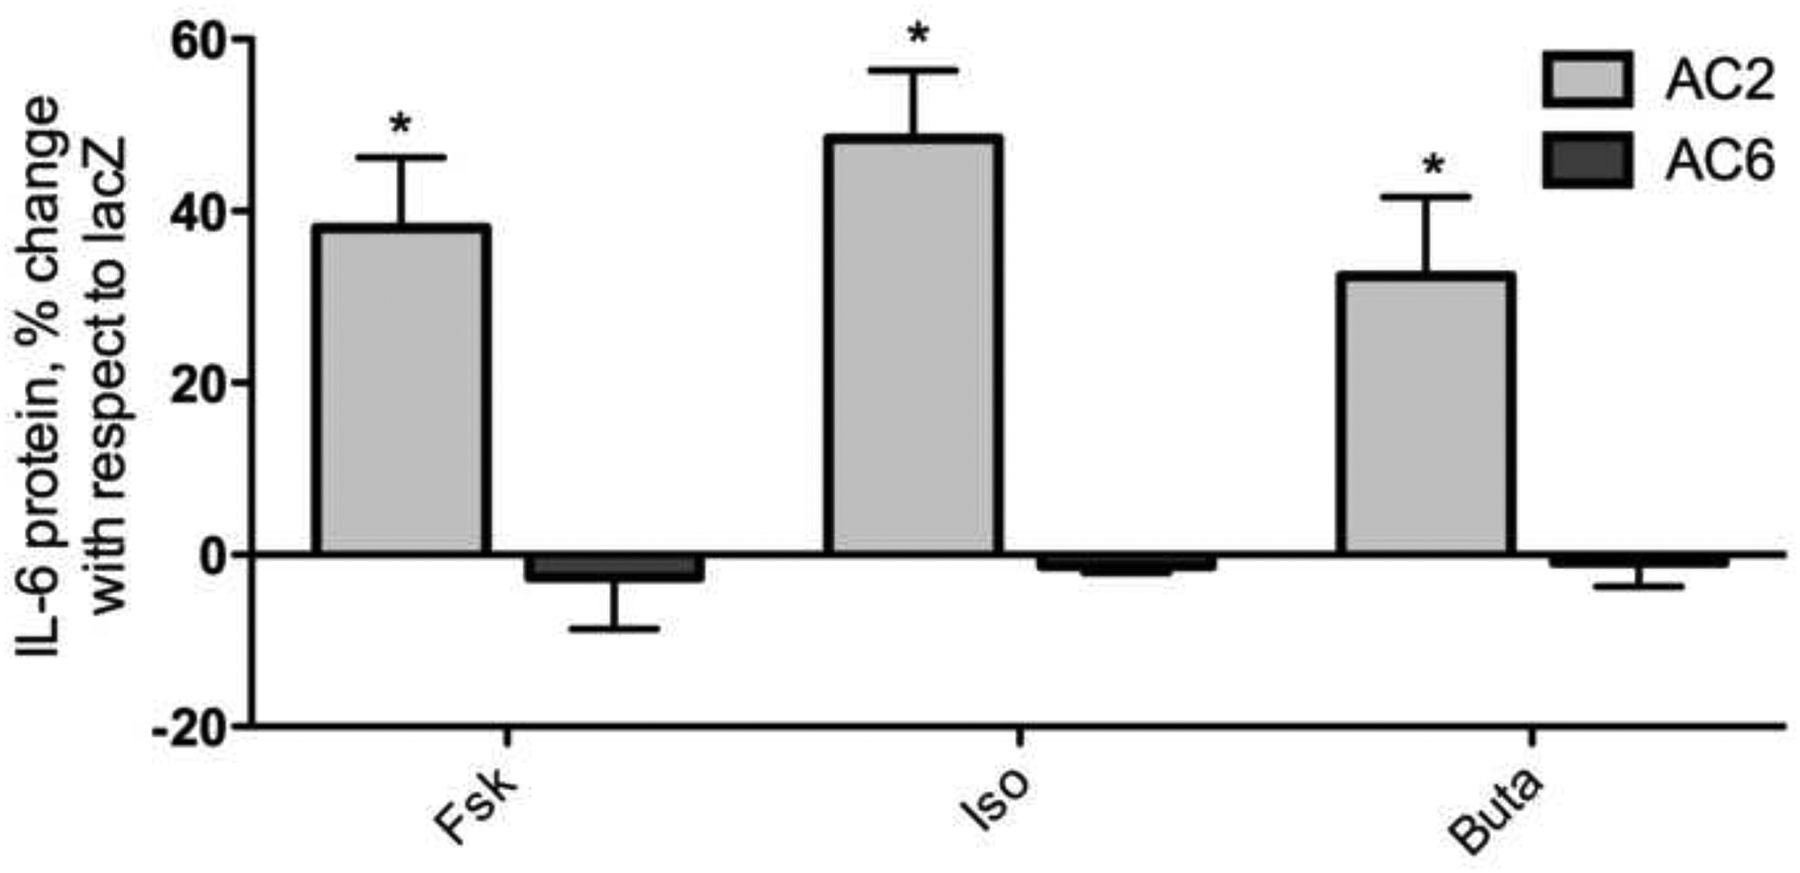
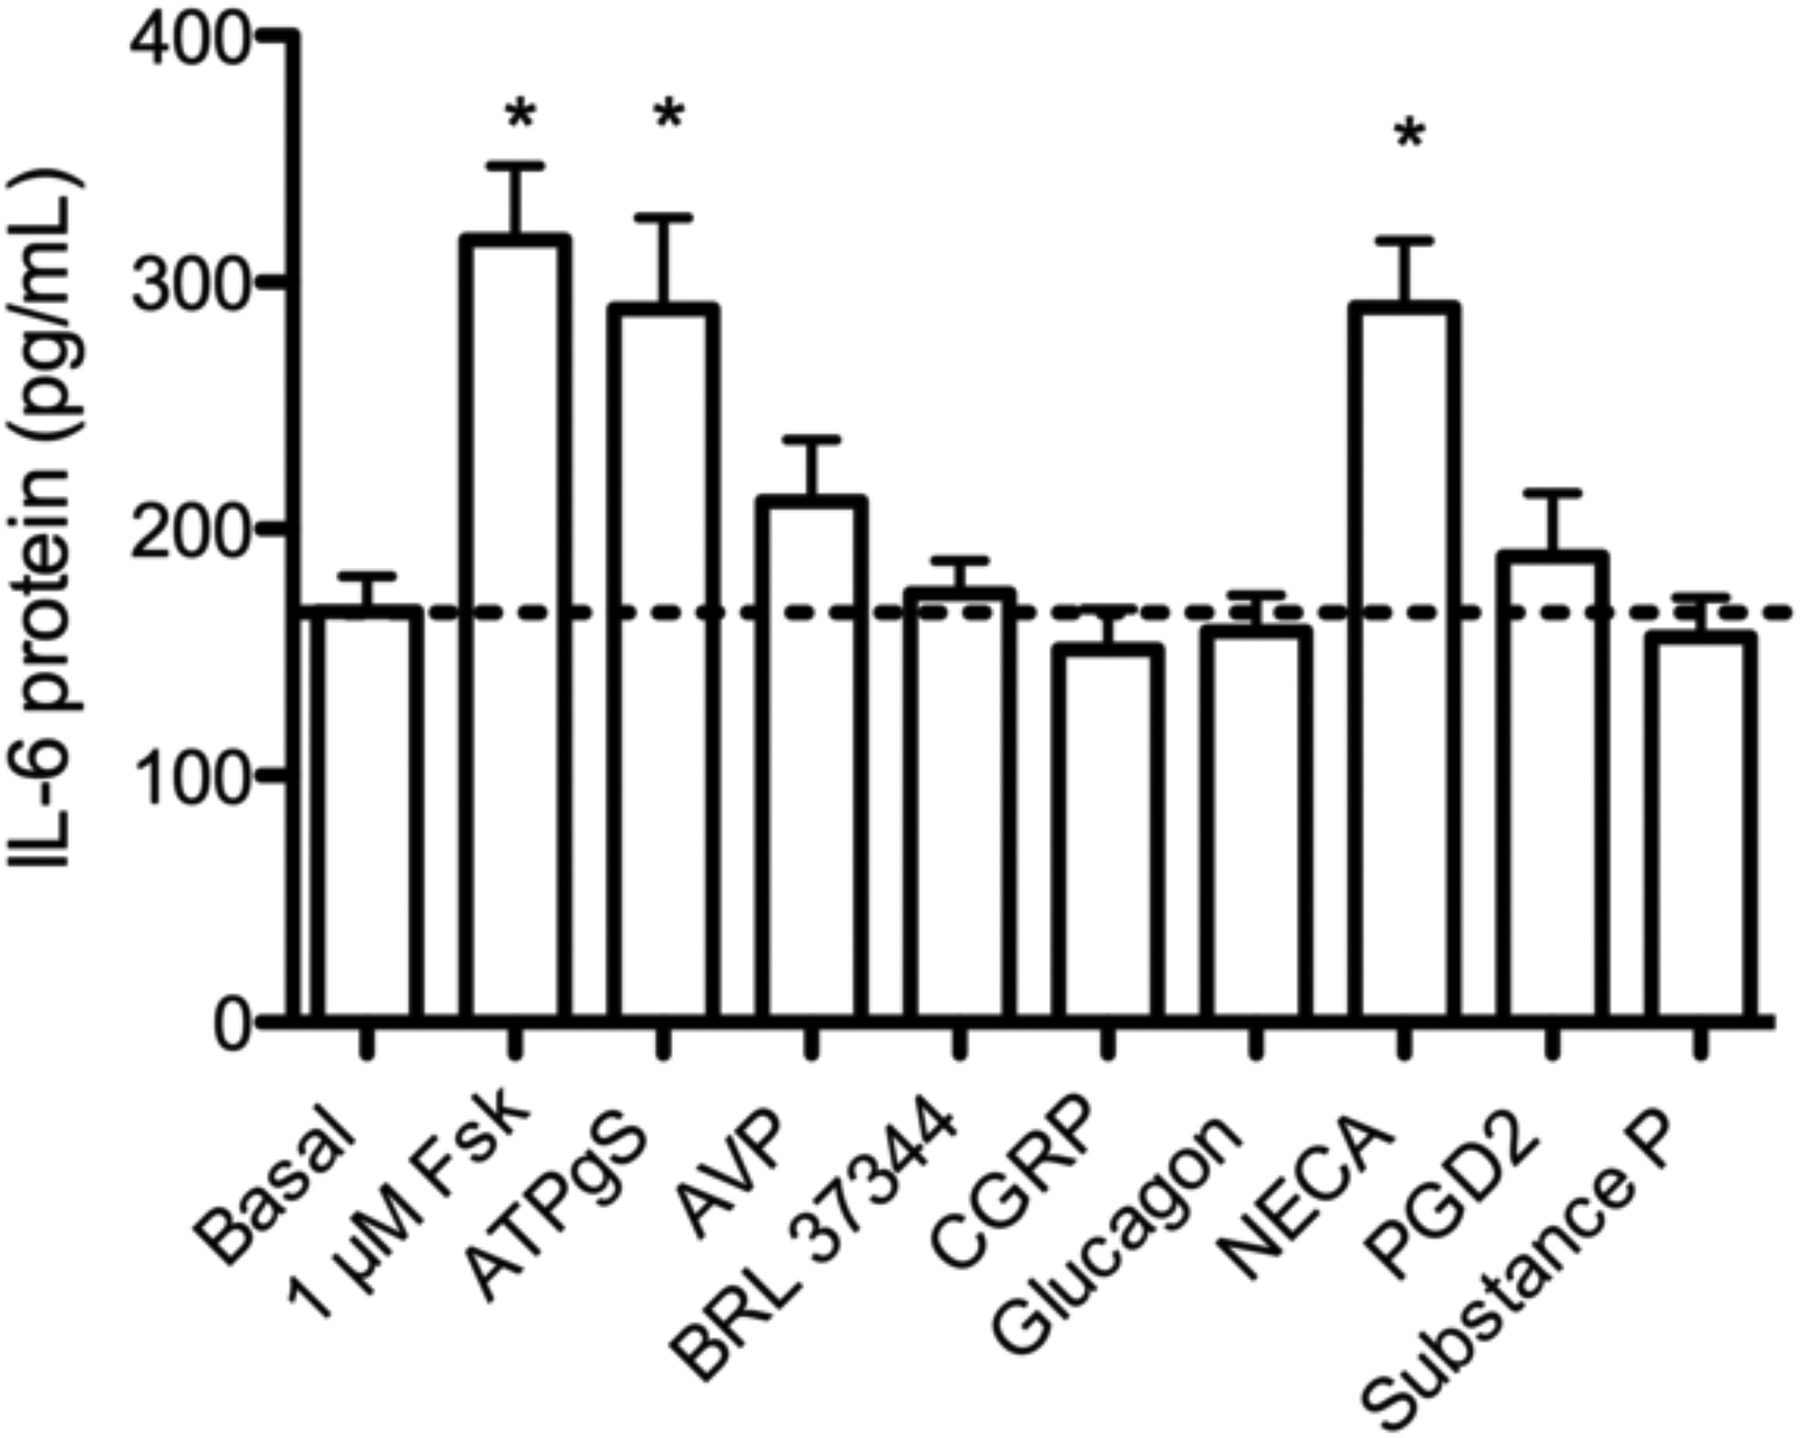
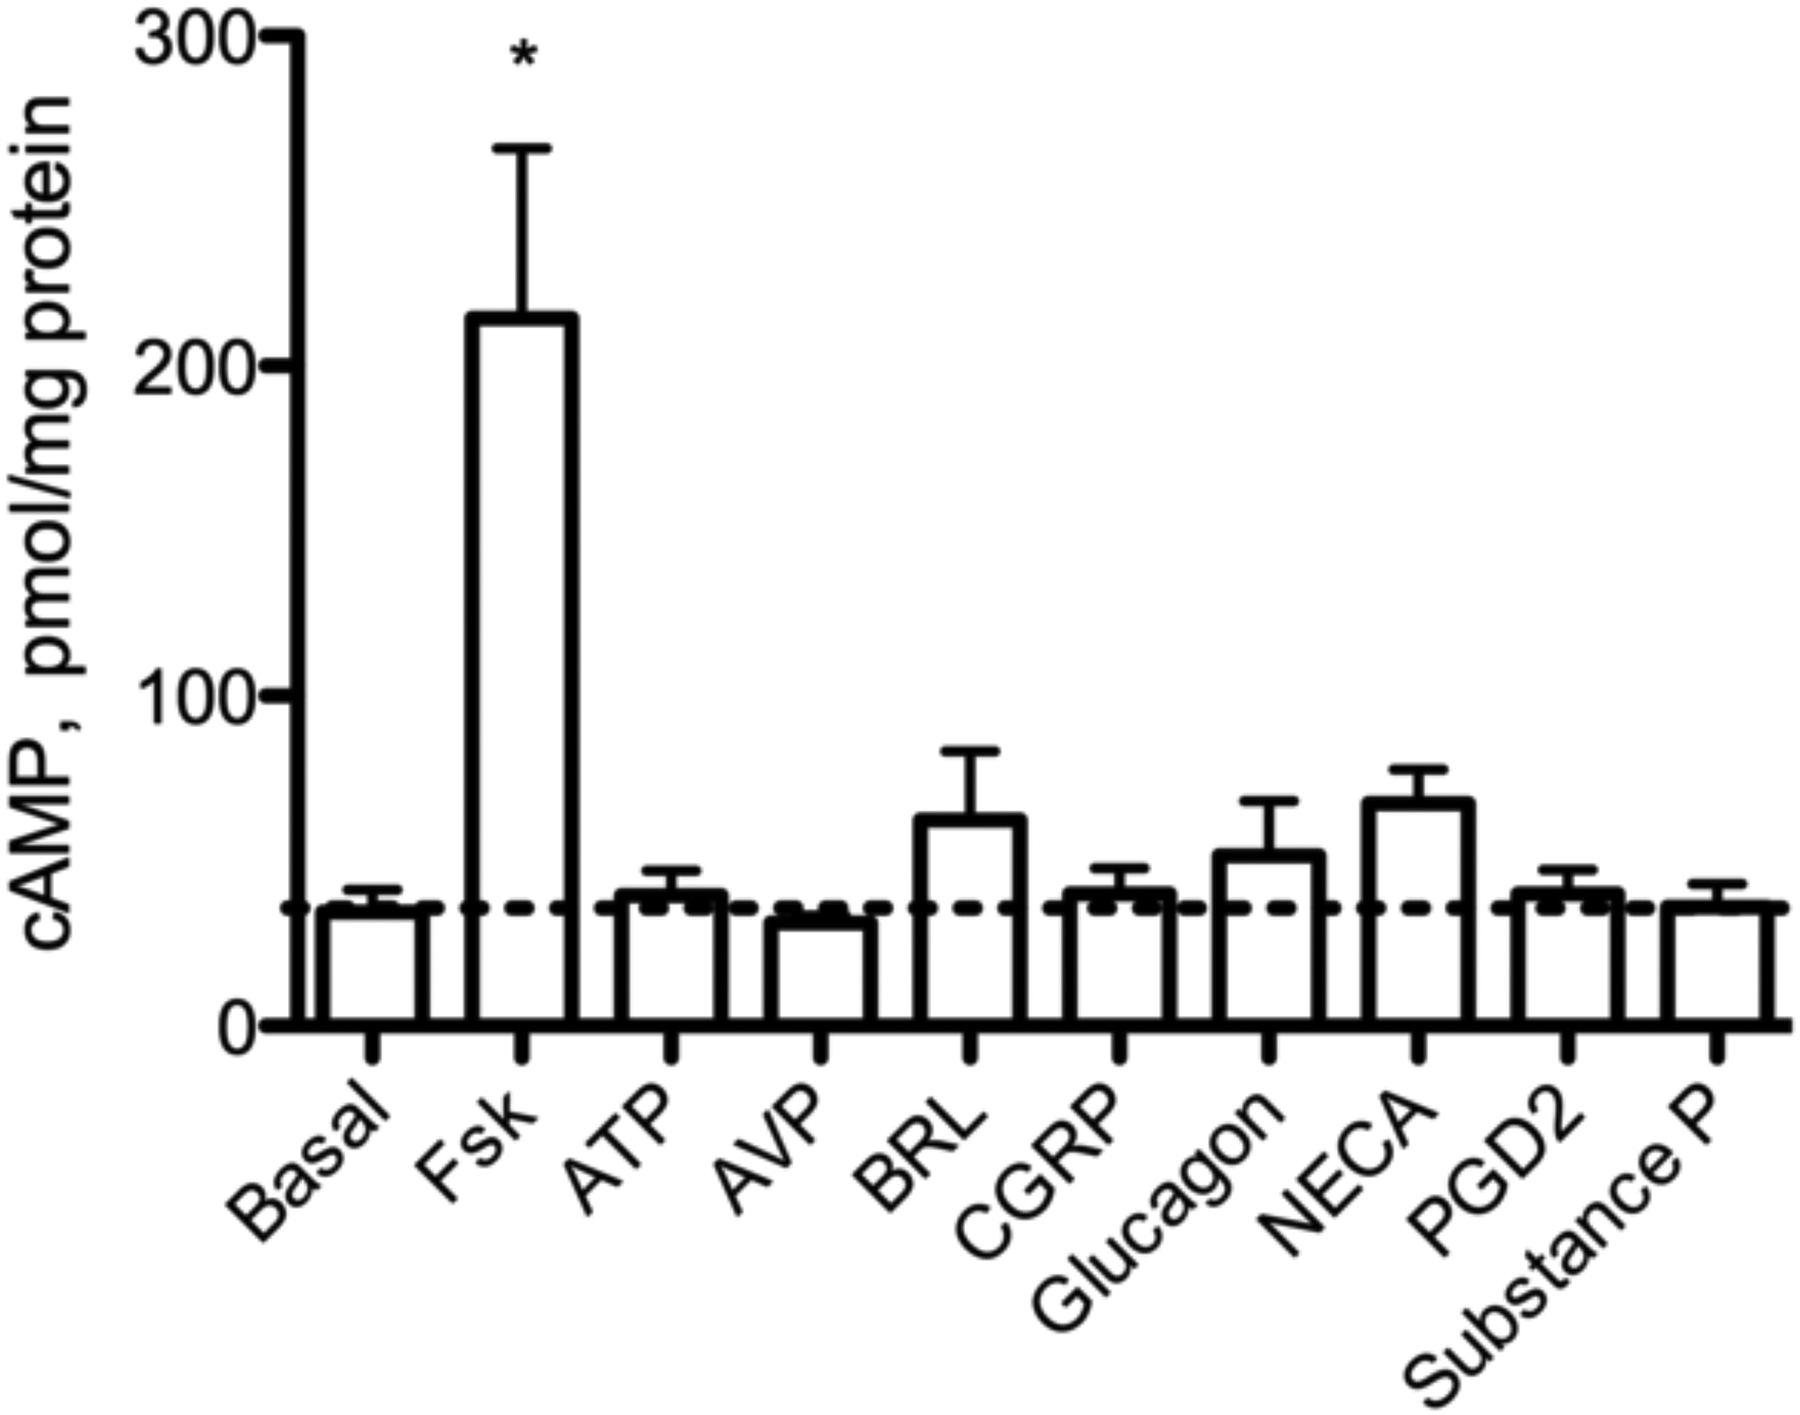
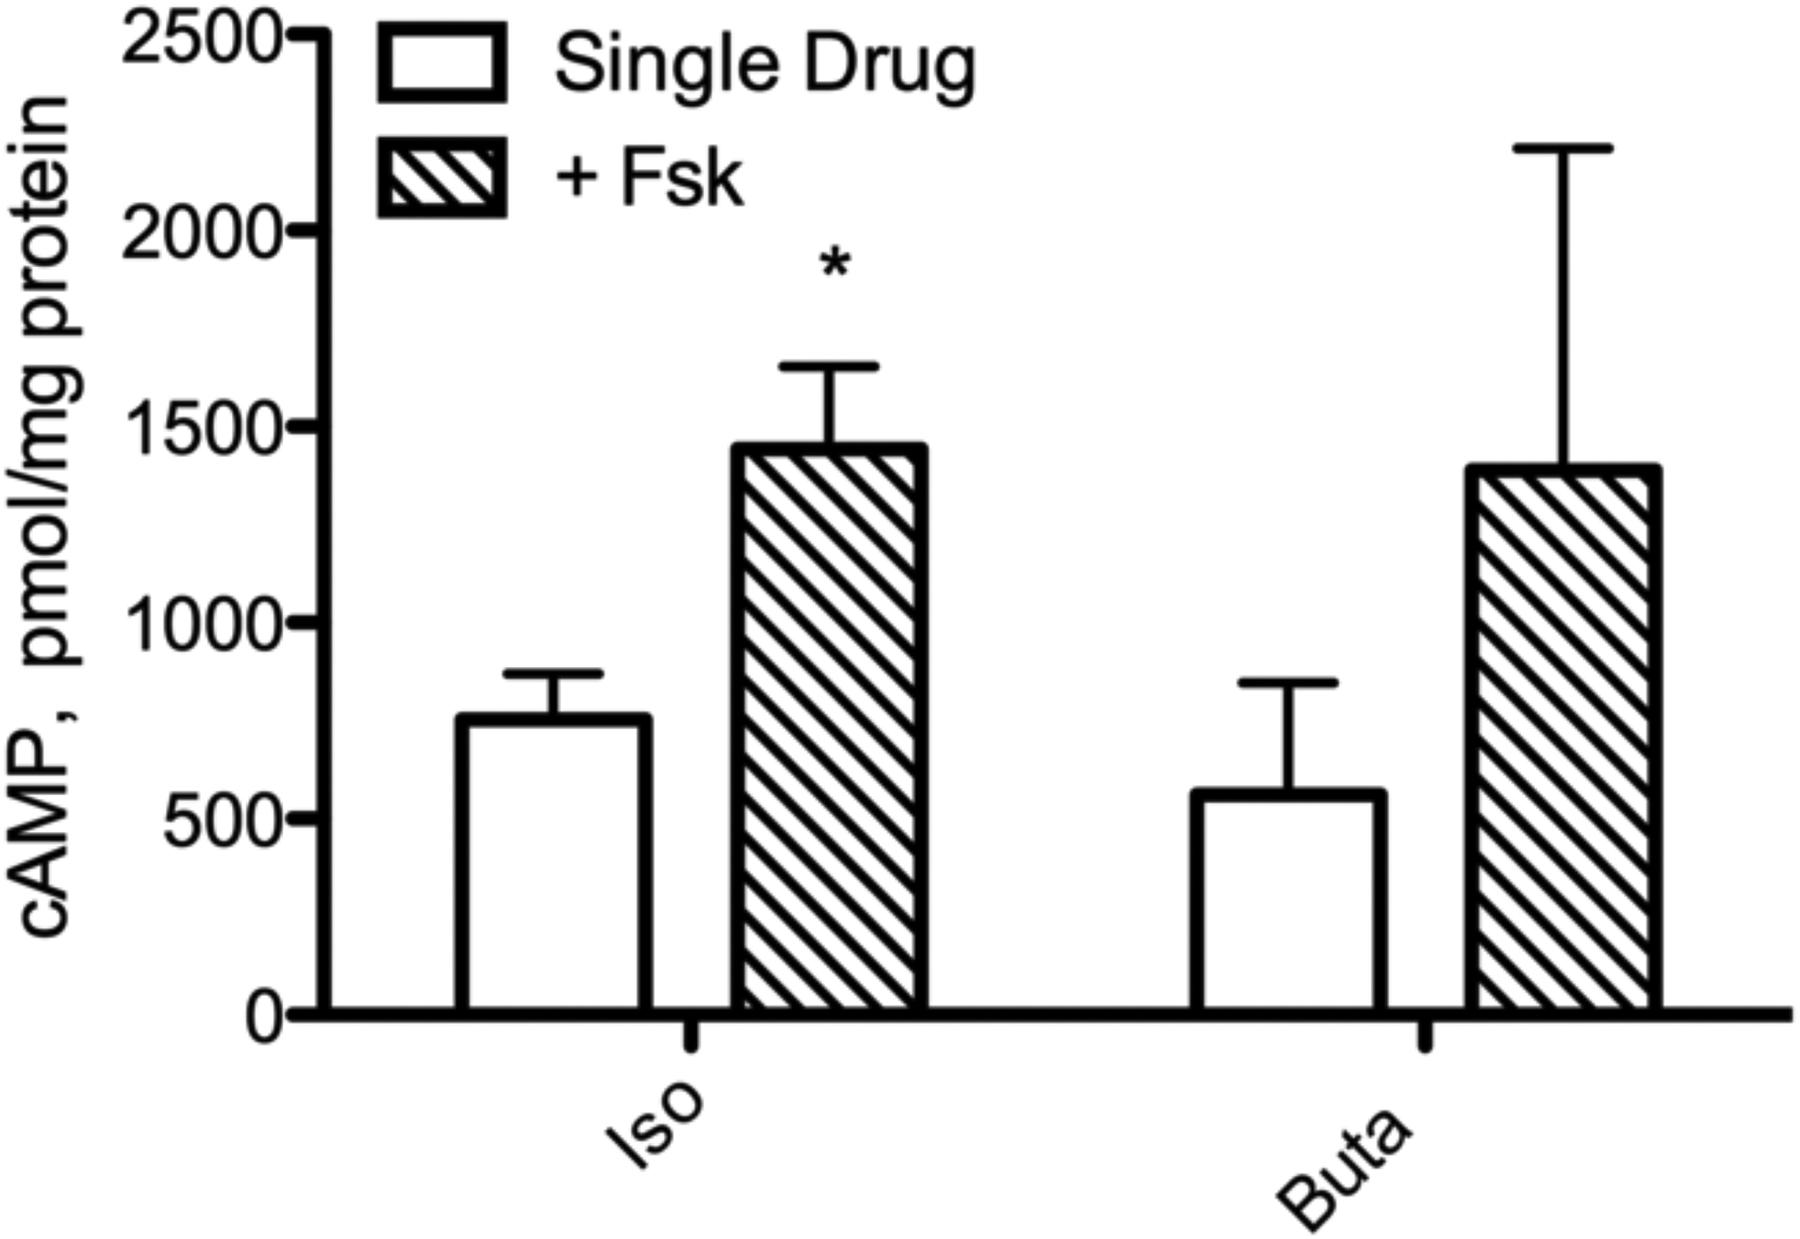
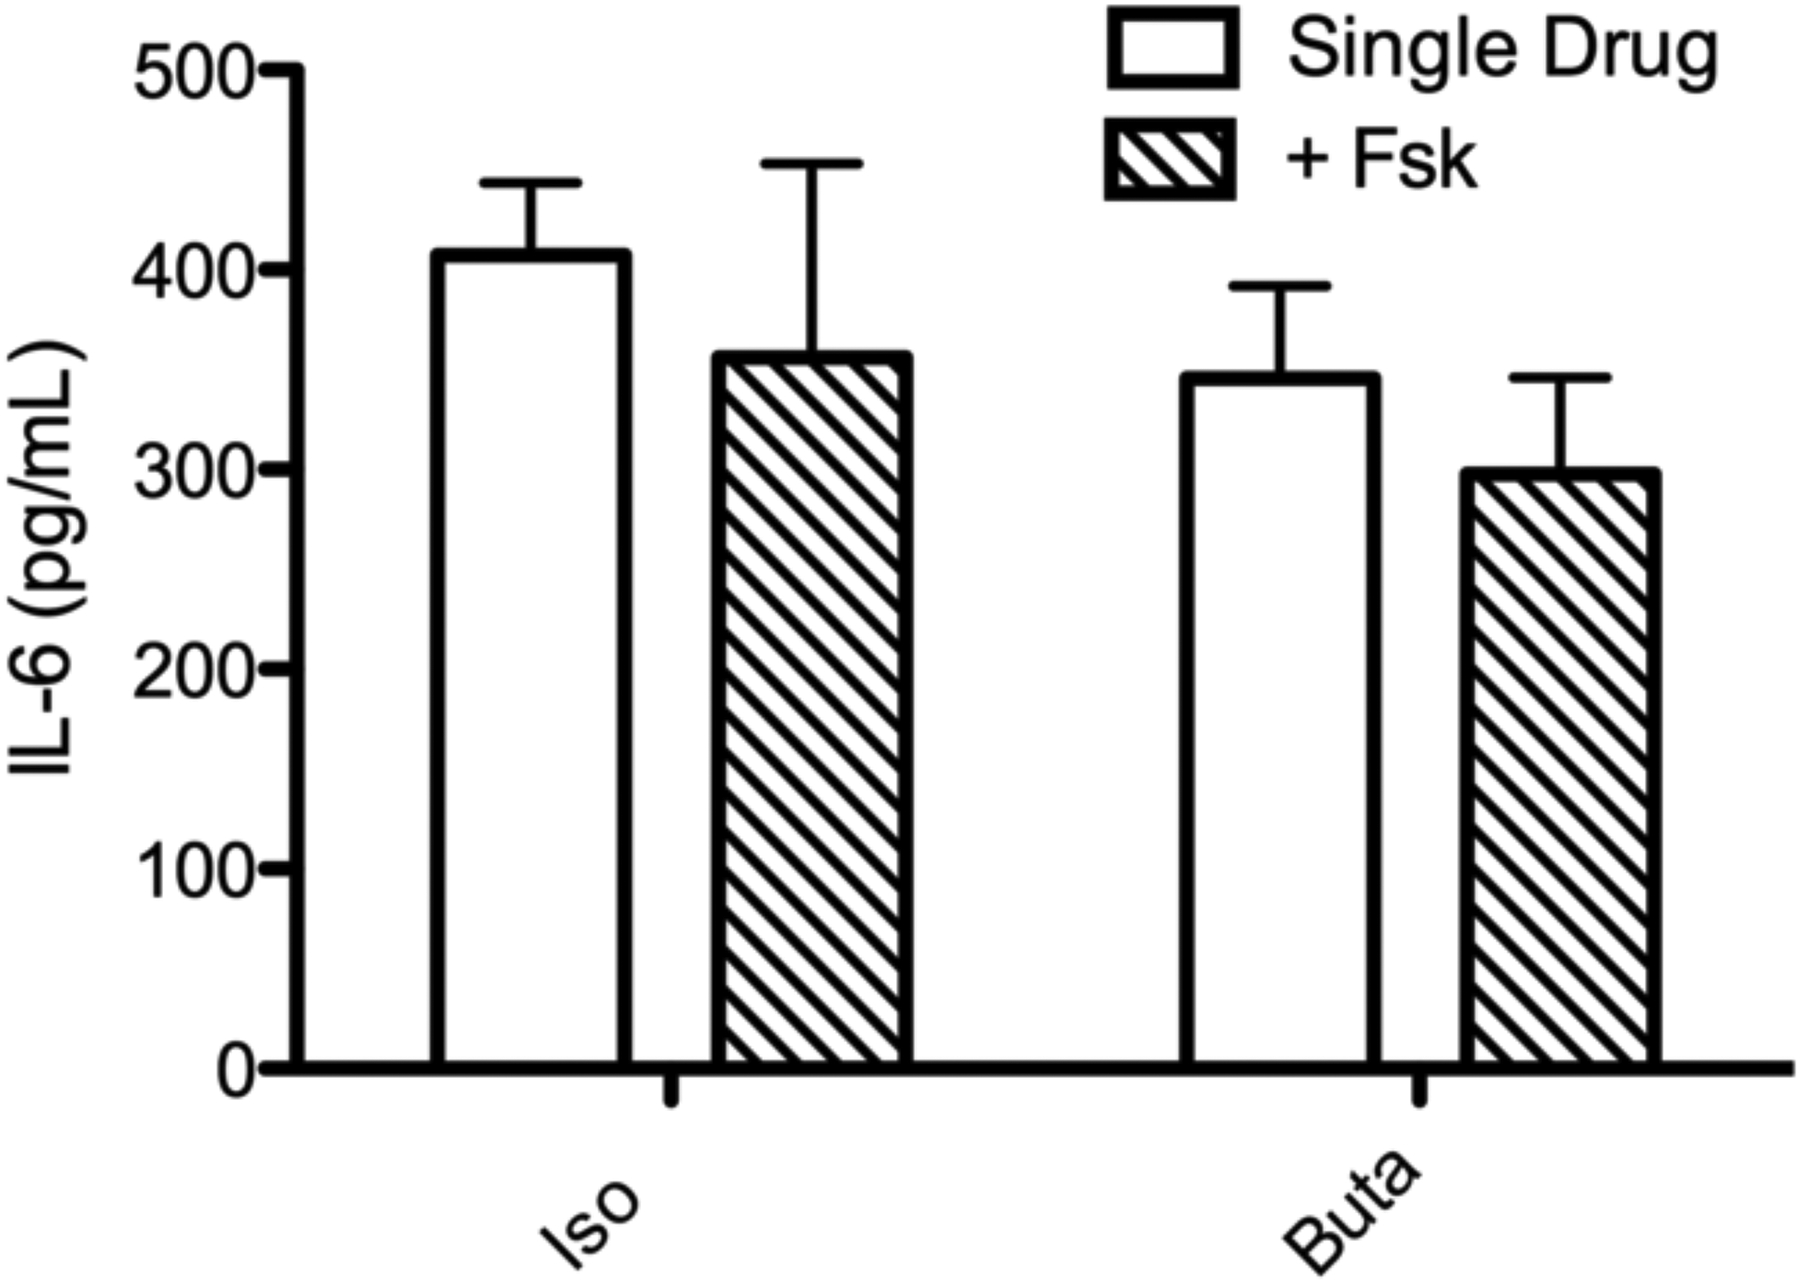
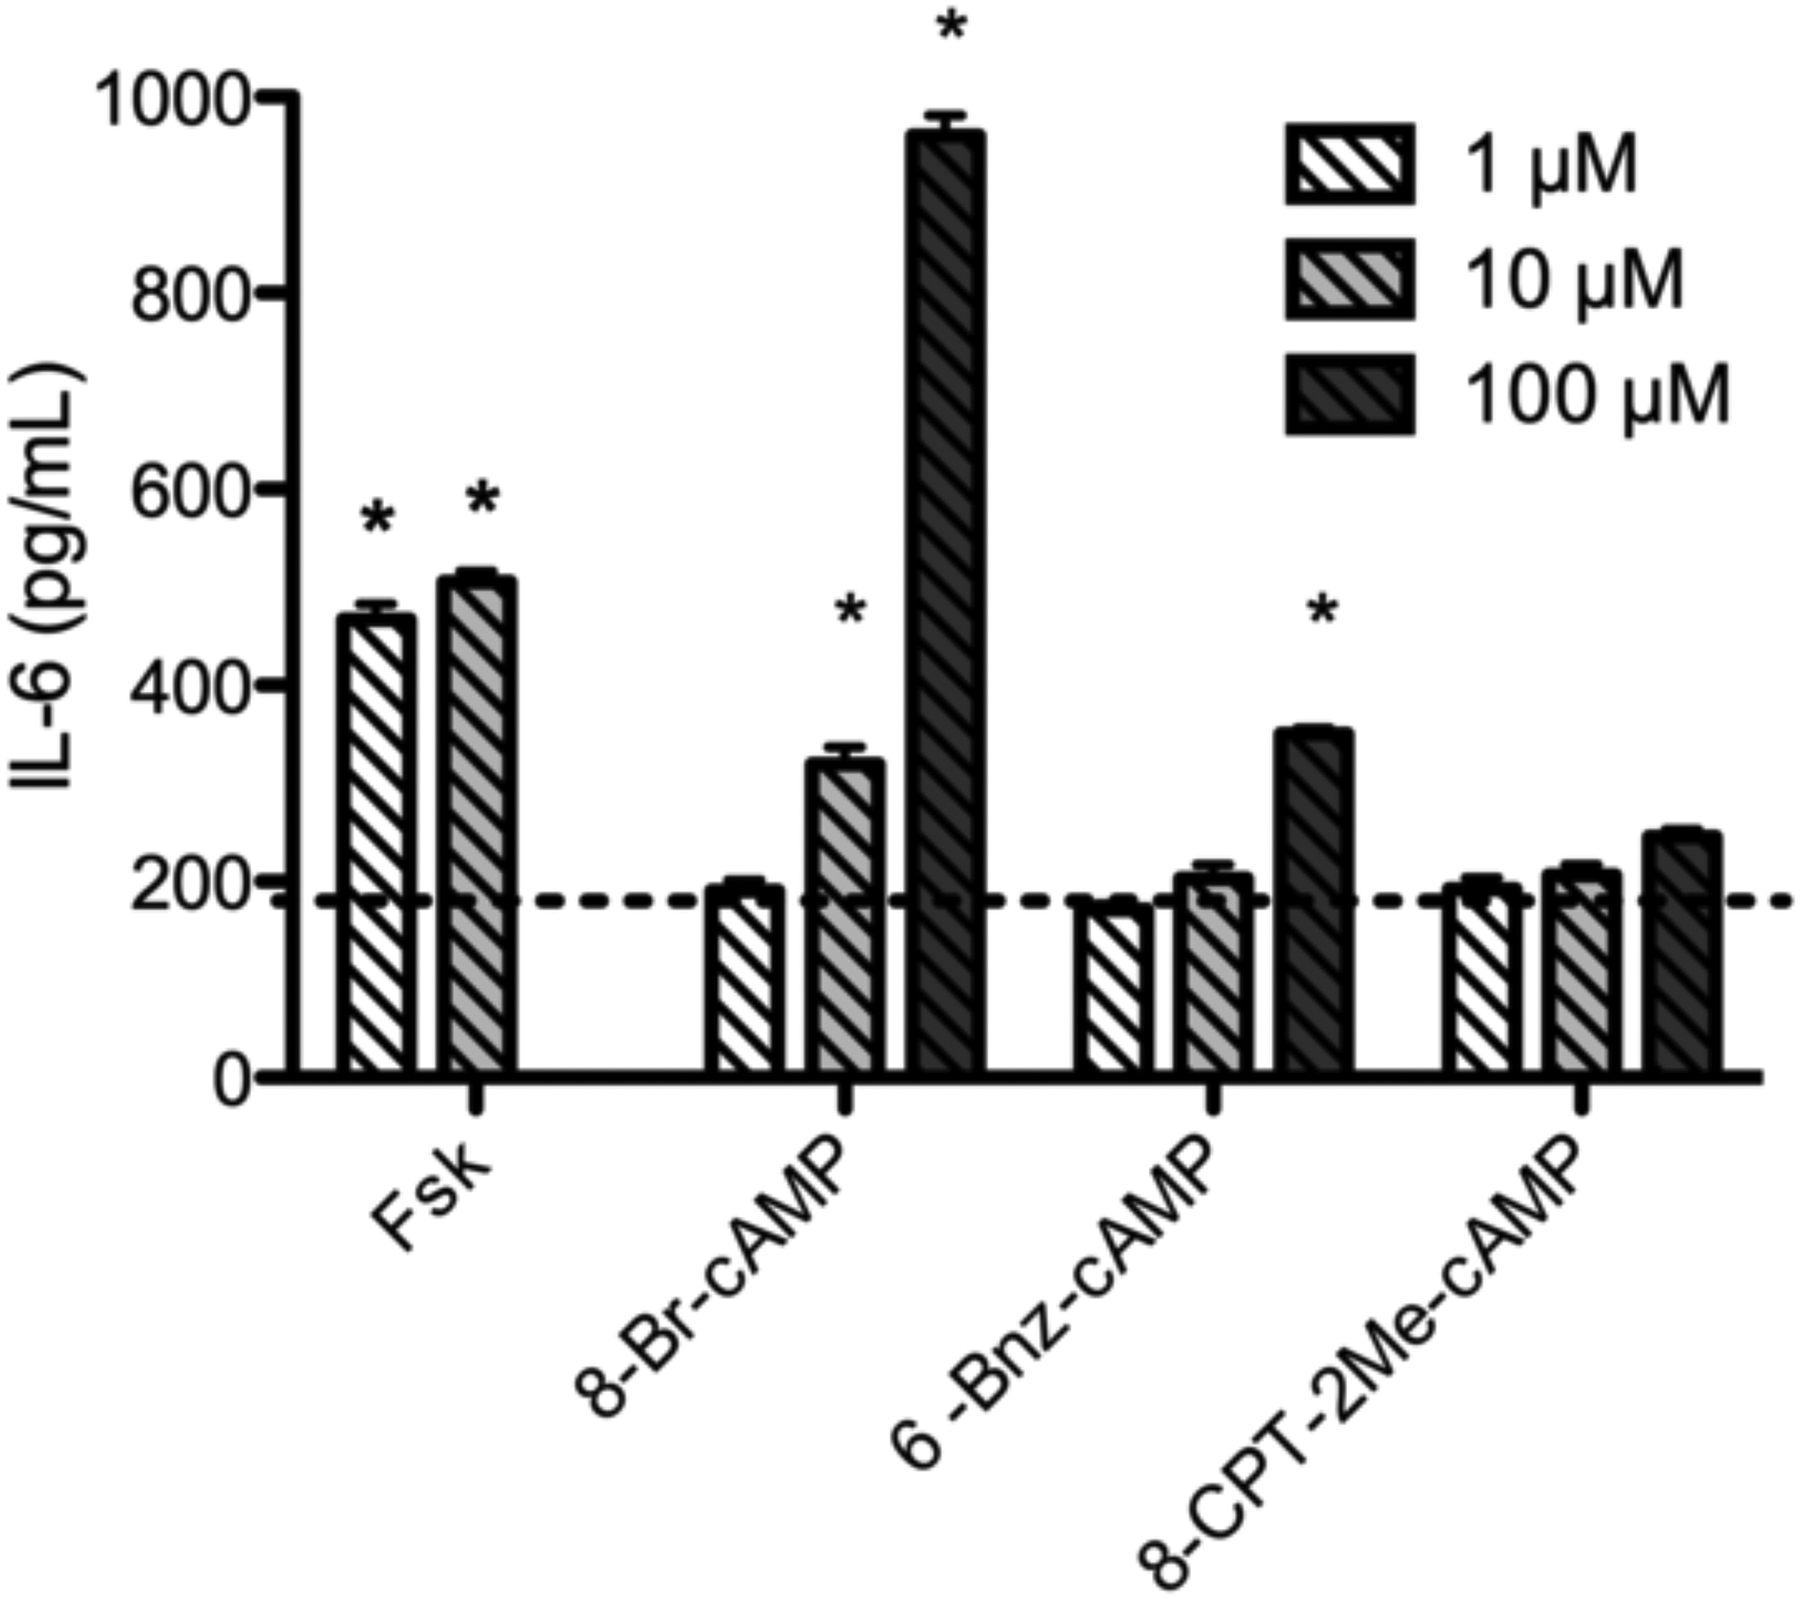
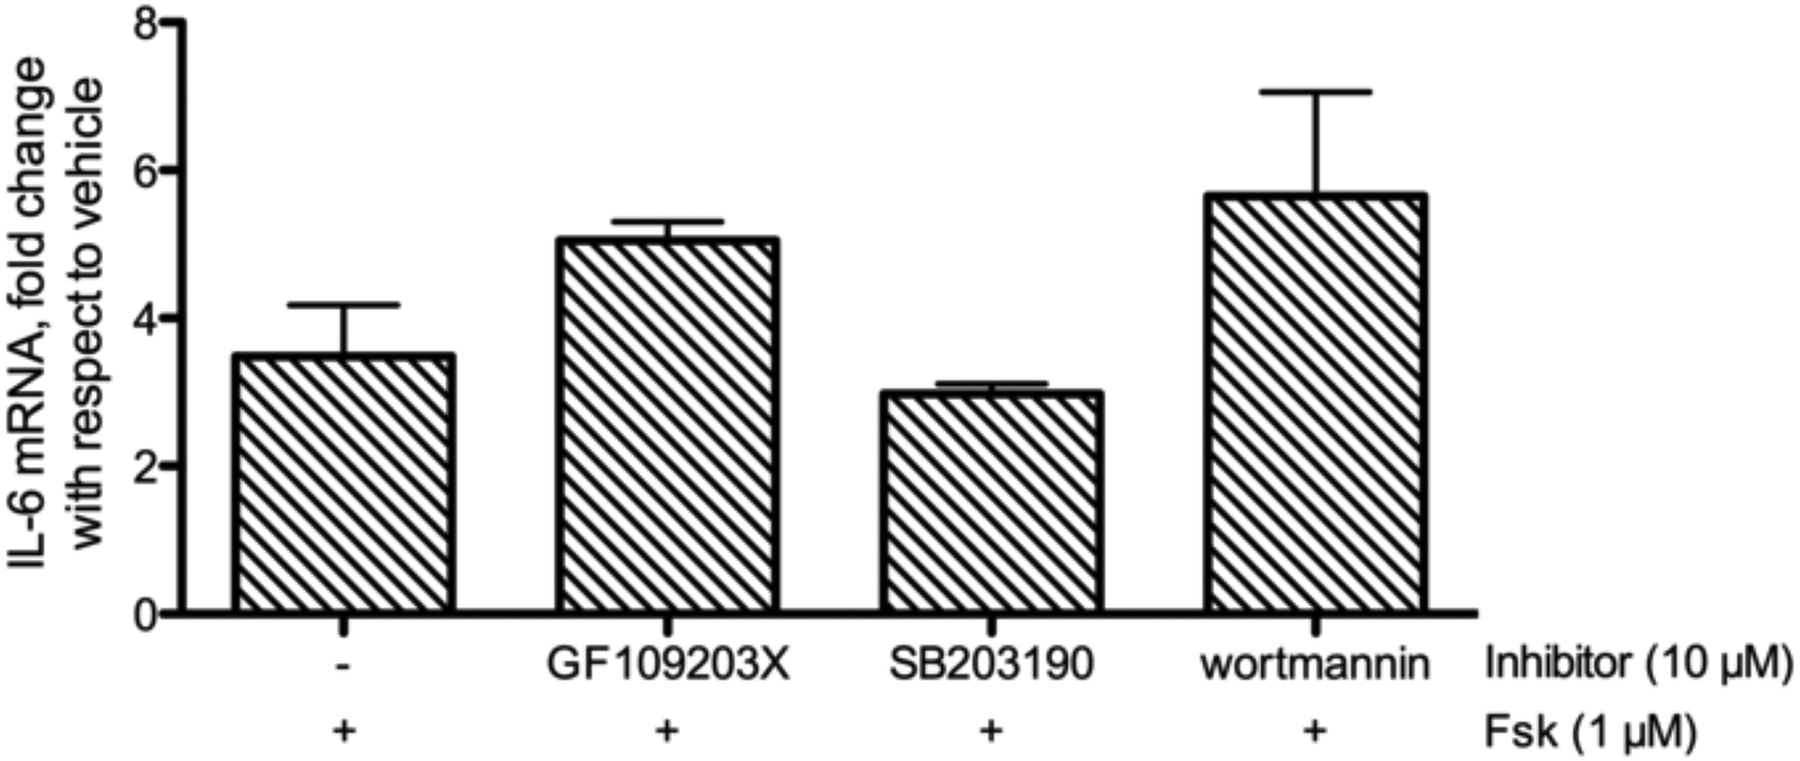
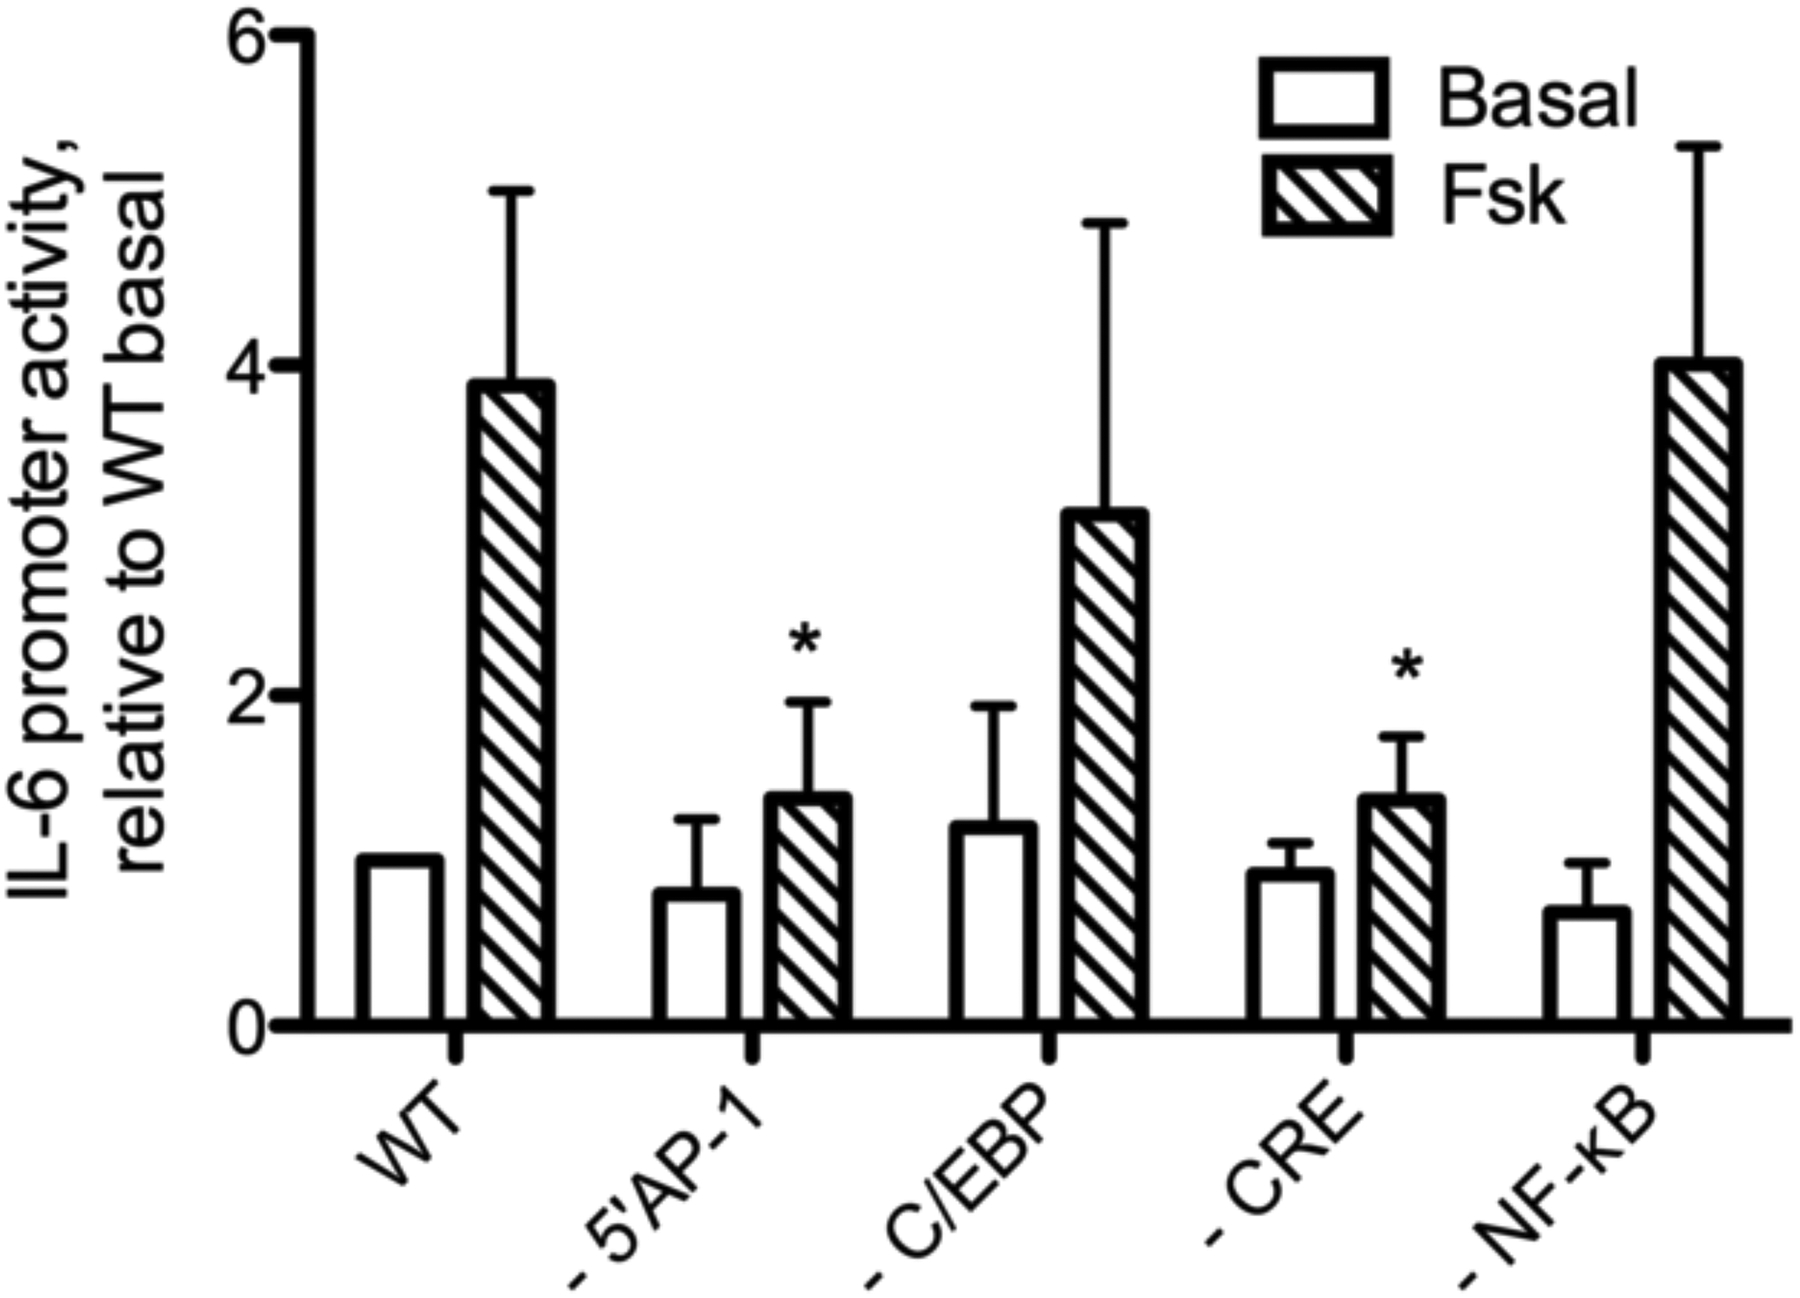
Adenylyl cyclase (AC) isoforms differ in their tissue distribution, cellular localization, regulation, and protein interactions. Most cell types express multiple AC isoforms. We hypothesized that cAMP produced by different AC isoforms regulates unique cellular responses in human bronchial smooth muscle cells (BSMC). Overexpression of AC2, AC3, or AC6 had distinct effects on forskolin (Fsk)-induced expression of a number of known cAMP-responsive genes. These data show that different AC isoforms can differentially regulate gene expression. Most notable, overexpression and activation of AC2 enhanced interleukin 6 (IL-6) expression, but overexpression of AC3 or AC6 had no effect. IL-6 production by BSMC was induced by Fsk and select G protein-coupled receptor (GPCR) agonists, though IL-6 levels did not directly correlate with global cAMP levels. Treatment with PKA selective 6-Bnz-cAMP or Epac selective 8-CPT-2Me-cAMP cAMP analogs revealed a predominant role for PKA in cAMP-mediated induction of IL-6. IL-6 promoter mutations demonstrated that AP-1 and CRE transcription sites were required for Fsk to stimulate IL-6 expression. Our present study defines an AC2 cAMP signaling compartment that specifically regulates IL-6 expression in BSMC via Epac and PKA and demonstrates that other AC isoforms are excluded from this pool.
Figures
Similar articles
-
Adenylyl cyclase 2 selectively couples to E prostanoid type 2 receptors, whereas adenylyl cyclase 3 is not receptor-regulated in airway smooth muscle.J Pharmacol Exp Ther. 2012 Aug;342(2):586-95. doi: 10.1124/jpet.112.193425. Epub 2012 May 22. J Pharmacol Exp Ther. 2012. PMID: 22619251 Free PMC article.
-
Localization of adenylyl cyclase isoforms and G protein-coupled receptors in vascular smooth muscle cells: expression in caveolin-rich and noncaveolin domains.Mol Pharmacol. 2002 Nov;62(5):983-92. doi: 10.1124/mol.62.5.983. Mol Pharmacol. 2002. PMID: 12391260
-
Adenylyl cyclase isoform-selective regulation of vascular smooth muscle proliferation and cytoskeletal reorganization.Circ Res. 2006 Oct 13;99(8):845-52. doi: 10.1161/01.RES.0000245189.21703.c0. Epub 2006 Sep 14. Circ Res. 2006. PMID: 16973907
-
Novel cAMP signalling paradigms: therapeutic implications for airway disease.Br J Pharmacol. 2012 May;166(2):401-10. doi: 10.1111/j.1476-5381.2011.01719.x. Br J Pharmacol. 2012. PMID: 22013890 Free PMC article. Review.
-
From membrane to nucleus: A three-wave hypothesis of cAMP signaling.J Biol Chem. 2024 Jan;300(1):105497. doi: 10.1016/j.jbc.2023.105497. Epub 2023 Nov 26. J Biol Chem. 2024. PMID: 38016514 Free PMC article. Review.
Cited by
-
Endoplasmic Reticulum-Plasma Membrane Contact Sites: Regulators, Mechanisms, and Physiological Functions.Front Cell Dev Biol. 2021 Feb 4;9:627700. doi: 10.3389/fcell.2021.627700. eCollection 2021. Front Cell Dev Biol. 2021. PMID: 33614657 Free PMC article. Review.
-
Targeting Adenylate Cyclase Family: New Concept of Targeted Cancer Therapy.Front Oncol. 2022 Jun 27;12:829212. doi: 10.3389/fonc.2022.829212. eCollection 2022. Front Oncol. 2022. PMID: 35832555 Free PMC article. Review.
-
PDE8 Is Expressed in Human Airway Smooth Muscle and Selectively Regulates cAMP Signaling by β2-Adrenergic Receptors and Adenylyl Cyclase 6.Am J Respir Cell Mol Biol. 2018 Apr;58(4):530-541. doi: 10.1165/rcmb.2017-0294OC. Am J Respir Cell Mol Biol. 2018. PMID: 29262264 Free PMC article.
-
Compartmentalized cAMP responses to prostaglandin EP2 receptor activation in human airway smooth muscle cells.Br J Pharmacol. 2017 Aug;174(16):2784-2796. doi: 10.1111/bph.13904. Epub 2017 Jul 12. Br J Pharmacol. 2017. PMID: 28603838 Free PMC article.
-
Role of protein kinase A and A kinase anchoring proteins in buffering and compartmentation of cAMP signalling in human airway smooth muscle cells.Br J Pharmacol. 2024 Aug;181(15):2622-2635. doi: 10.1111/bph.16357. Epub 2024 Apr 12. Br J Pharmacol. 2024. PMID: 38613158 Free PMC article.
References
-
- Ammit AJ, Lazaar AL, Irani C, O’Neill GM, Gordon ND, Amrani Y, Penn RB, Panettieri RA Jr. (2002) Tumor Necrosis Factor-alpha -Induced Secretion of RANTES and Interleukin-6 from Human Airway Smooth Muscle Cells. Modulation by Glucocorticoids and beta -Agonists. Am J Respir Cell Mol Biol 26 (4):465–474 - PubMed
-
- Bayewitch ML, Avidor-Reiss T, Levy R, Pfeuffer T, Nevo I, Simonds WF, Vogel Z (1998) Inhibition of adenylyl cyclase isoforms V and VI by various Gbetagamma subunits. The FASEB journal : official publication of the Federation of American Societies for Experimental Biology 12 (11):1019–1025 - PubMed
Publication types
MeSH terms
Substances
Grants and funding
LinkOut - more resources
Full Text Sources
Other Literature Sources
Molecular Biology Databases
