

Review
doi: 10.1039/c3cs60124b.
Epub 2013 Dec 20.
Chemistry and biochemistry of 13C hyperpolarized magnetic resonance using dynamic nuclear polarization
Affiliations
- PMID: 24363044
- PMCID: PMC4086923
- DOI: 10.1039/c3cs60124b
Item in Clipboard
Review
Chemistry and biochemistry of 13C hyperpolarized magnetic resonance using dynamic nuclear polarization
Chem Soc Rev.
.
Abstract
The study of transient chemical phenomena by conventional NMR has proved elusive, particularly for non-(1)H nuclei. For (13)C, hyperpolarization using the dynamic nuclear polarization (DNP) technique has emerged as a powerful means to improve SNR. The recent development of rapid dissolution DNP methods has facilitated previously impossible in vitro and in vivo study of small molecules. This review presents the basics of the DNP technique, identification of appropriate DNP substrates, and approaches to increase hyperpolarized signal lifetimes. Also addressed are the biochemical events to which DNP-NMR has been applied, with descriptions of several probes that have met with in vivo success.
Figures
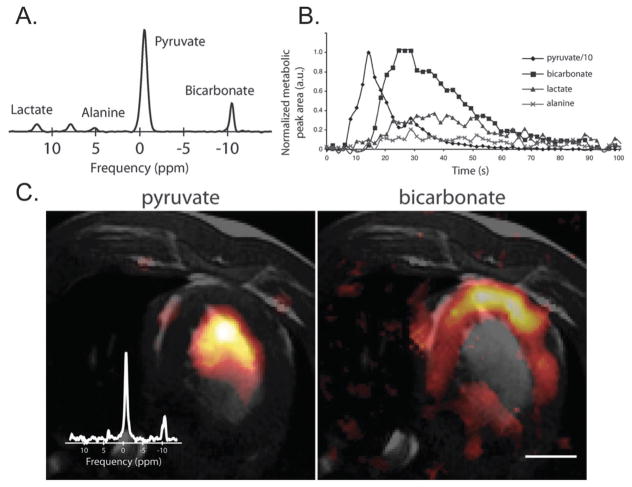
(A) Single 13C spectrum acquired following injection of 15 ml of HP [1-13C] pyruvate at 3 T in a porcine heart. The pyruvate was injected at a constant rate from 0 to 15 s. (B) To generate the time course, spectra were acquired every 2 s using a 10° flip angle and a 10 cm slice. The peak height plot demonstrates the time course of pyruvate delivery and lactate, alanine and bicarbonate labeling. (C) Axial T2-weighted 1H image depicting the porcine heart with color overlays reconstructed from MRSI data. Cardiac-gated data demonstrate the spatial distribution of pyruvate and bicarbonate in a single 10 mm axial slice. The inset spectrum is a sum over all magnitude spectra. The scale bar indicates 2 cm. The color scale for both images ranges from 15 to 100% of the image intensity maximum. Adapted from ref. .
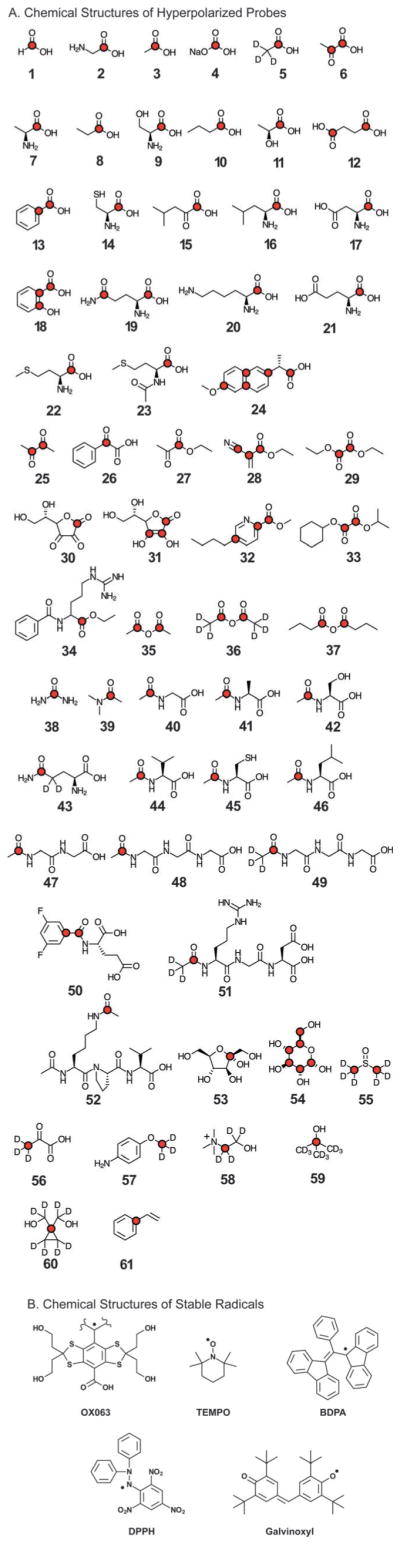
(A) Chemical structures of compounds that have been HP. Long-T1 nuclei (those without directly attached 1H) that have been studied by DNP-NMR are labeled. These correspond to Table 3. (B) Chemical structures of stable organic free radicals used for hyperpolarization.
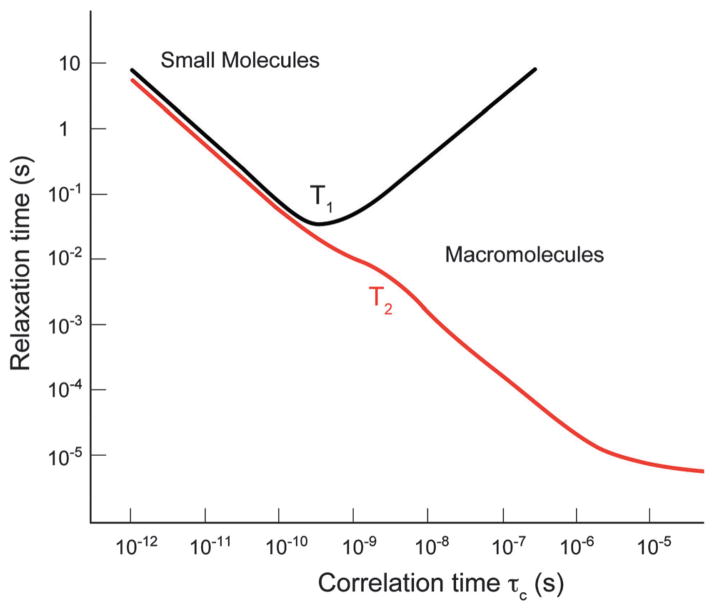
Plot of relaxation time versus correlation time (τc) demonstrates the expected changes in T1 and T2 relaxation with molecule size. Adapted from ref. .
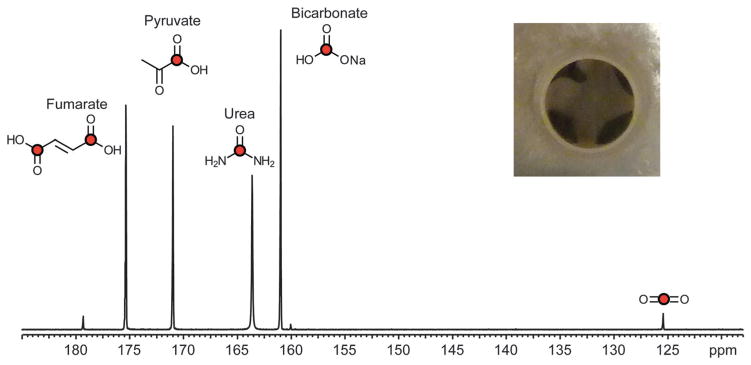
Multi-compound polarization demonstrates the simultaneous dissolution of [1-13C] pyruvate, 13C-bicarbonate, 13C-urea, [1,4-13C2] fumarate at 11.7 T. The inlay image is a top down view of a standard sample cup with all 4 compound preparations frozen together prior to placement in the hyperpolarizer. Adapted from ref. .
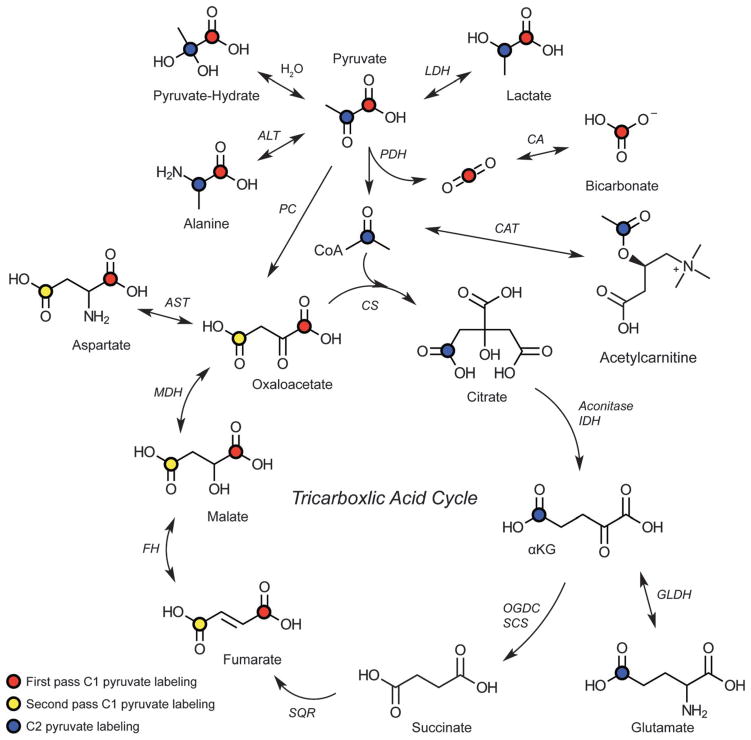
Biochemical scheme of labeling resulting from the injection of HP pyruvate. Carbons that have been observed via metabolism of HP substrates are labeled. Red dots indicate labeling from the C1 of pyruvate in the first pass of metabolism. Yellow dots indicate the fate of the C1 carbon if it were to enter through pyruvate carboxylase and progress backward to fumarate. At this point, the label can scramble due to symmetry. The blue dots indicate the labeled intermediates derived from metabolism of C2 pyruvate. TCA has been abbreviated for the purposes of clarity, though the necessary enzymes are listed and cofactors have been omitted. Abbreviations: LDH – lactate dehydrogenase (EC 1.1.2.4), ALT – alanine transaminase (EC 2.6.1.2), CA – carbonic anhydrase (EC 4.2.1.1), PDH – pyruvate dehydrogenase complex (EC 1.2.4.1, 2.3.1.12 and 1.8.1.4), CAT – carnitine o-acetyltransferase (EC 2.3.1.7), PC – pyruvate carboxylase (EC 6.4.1.1), CS – citrate synthase (EC 2.3.3.1), aconitase (EC 4.2.1.3), IDH – isocitrate dehydrogenase (EC 1.1.1.42), OGDC – oxoglutarate dehydrogenase complex (EC 1.2.4.2), SCS – succinyl coenzyme A synthetase (EC 6.2.1.4), SQR – succinate dehydrogenase (EC 1.3.5.1), FH – fumarate hydratase (EC 4.2.1.2), MDH – malate dehydrogenase (EC 1.1.1.37), AST – aspartate transaminase (EC 2.6.1.1), GLDH – glutamate dehydrogenase (EC 1.4.1.2). CoA – coenzyme A.
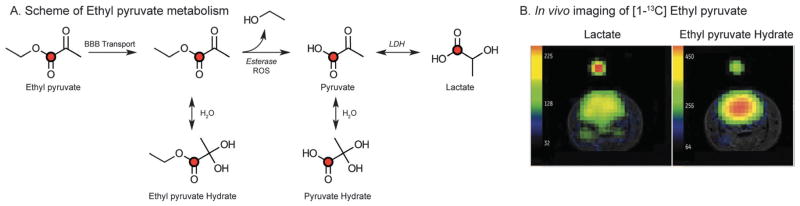
(A) Scheme of transport across the blood brain barrier (BBB) and subsequent metabolism of ethyl pyruvate. Ethyl pyruvate can be hydrolyzed by either esterases or reactive oxygen species (ROS). LDH – lactate dehydrogenase. (B) Representative axial imaging of a normal rat brain demonstrating the distribution of HP ethyl pyruvate hydrate and subsequent lactate generated at 3 T. HP images are overlaid on standard T2-weighted anatomic images. Adapted from ref. .

Chemical structure of tocopherol (vitamin E) demonstrating carbons with long T1s for potential labeling and hyperpolarization. These carbons are indicated by the red dots.
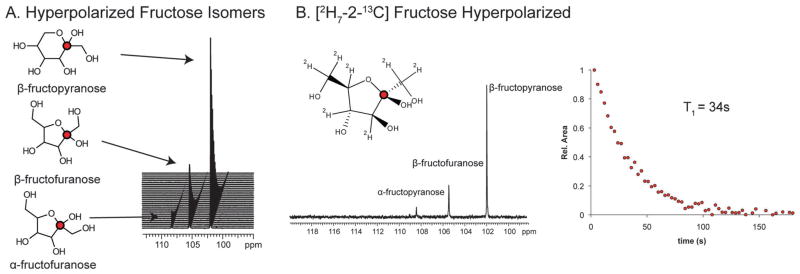
(A) Chemical structures of fructose isomers with accompanying HP resonances. HP [2-13C] fructose was dissolved in 1× phosphate buffered saline (PBS, pH = 7.6) to a concentration of 5 mM. The dynamic spectra were acquired on an 11.7 T with a temporal resolution of 3 s and flip angle of 5°. Adapted from ref. . (B) Chemical structure of the furanose isomer of fructose uniformly deuterated with a HP spectrum acquired on 10 mM fructose in PBS (pH = 7.5) using a flip angle of 5°. Corresponding apparent T1 decay of the HP signal is shown at the right, nearly 34 s in solution.
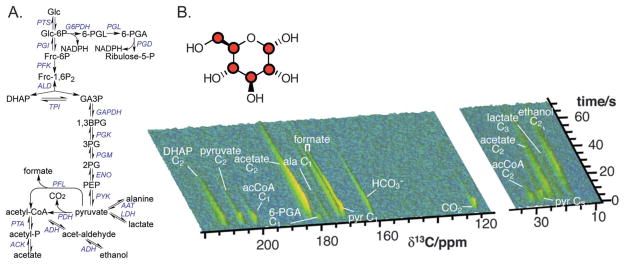
(A) Overview of metabolism observed in Escherichia coli interrogated using HP [U-13C, U-2H] glucose. The reactions of glycolysis, the pentose phosphate shunt, and fermentation are displayed. These pathways are nearly identical to those observed in yeast (Saccharomyces cerevisiae). (B) Time-resolved HP 13C NMR spectra recorded every 0.5 s demonstrating generation of 13C metabolites in real time. The overall signal decreases with loss of hyperpolarization. Adapted from ref. . Abbreviations: 1,3BPG – 1,3 bisphosphoglycerate, 2PG – 2-phosphoglycerate, 3PG – 3-phosphoglycerate, 6-PG – 6-phosphogluconate, 6-PGL – 6-phospho-Δ-gluconolactone, AAT – alanine aminotransferase (EC 2.6.1.2), Ac – acetate, Ac-CoA – acetyl-CoA, ACK –acetyl kinase (EC 2.7.2.1), ADH – alcohol dehydrogenase (EC 1.1.1.1), ALD – aldolase (EC 4.1.2.13), DHAP – dihydroxyacetone phosphate, ENO – enolase (EC 4.2.1.11), Frc-1,6P2 – fructose-1,6-bisphosphate, Frc-6P – fructose-6phosphate, G6PDH – glucose-6-phosphate dehydrogenase (EC 1.1.1.49), GA3P – glyceraldehyde 3-phosphate, GAPDH – glyceraldehydes-3-phosphate dehydrogenase (EC 1.2.1.12), Glc – glucose, Glc-6P – glucose-6phosphate, LDH – lactate dehydrogenase (EC 1.1.1.27), PDC – pyruvate decarboxylase (EC 4.1.1.1), PEP – phosphoenolpyruvate, PFL – pyruvate formate lyase (EC 2.3.1.54), PFK – phosphofructokinase (EC 2.7.1.11), PGD – 6-phosphogluconate dehydrogenase (EC 1.1.1.43), PGL – 6-phosphogluconate lactonase (EC 3.1.1.31), PGK – phosphoglycerate kinase (EC 2.7.2.3), PGM – phosphoglycerate mutase (EC 5.4.2.1), PTA – phosphotransacetylase (EC 2.3.1.8), PTS –glucose-specific enzyme II of the phosphotransferase system (2.7.1.63), Pyr – pyruvate, PYK – pyruvate kinase (EC 2.7.1.40), TPI – triosephosphate isomerase (EC 5.3.1.1).
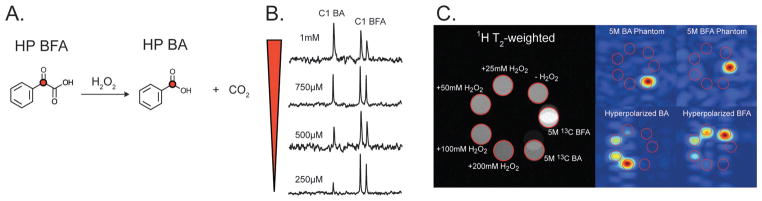
(A) Reaction scheme of HP [2-13C] benzoylformic acid (BFA) reaction with H2O2 to form HP [1-13C] benzoic acid (BA). (B) With increasing concentrations of H2O2, a proportional amount of HP BA is formed. These spectra were acquired with a single 90° pulse after incubation of HP BFA with H2O2 at 11.7 T. (C) Phantom images of 5 M thermally polarized 13C BFA in H2O, 5 M thermally polarized 13C BA in DMA, and 20 mM HP 13C BFA in 100 mM phosphate, 0.3 mM EDTA buffered at pH 7.8 with 0, 25, 50, 100, and 200 mM H2O2. HP Images were acquired after ~37 s of reaction with H2O2 with a TR = 150 ms, FOV 40 × 40 × 40 mm, 16 × 12 × 12 matrix, and zero-filled to a final resolution of 1.25 mm isotropic, at 14 T. Adapted from ref. .
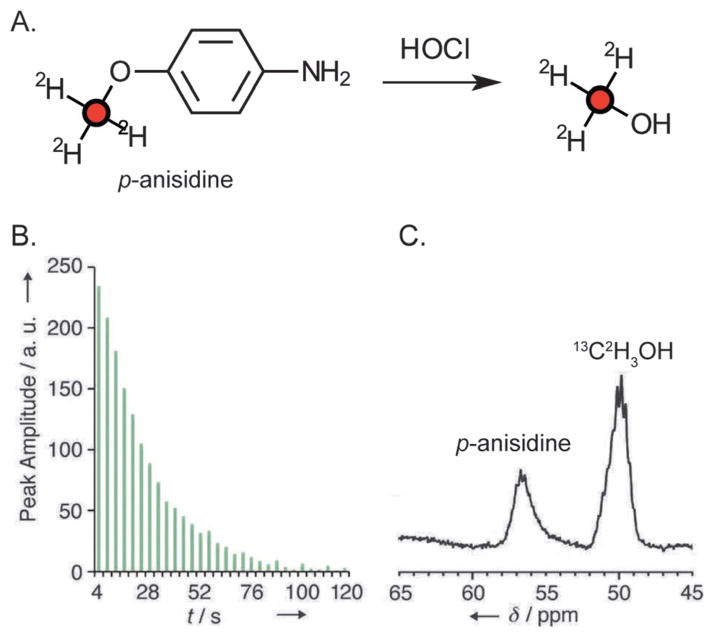
(A) Reaction of [13C,D3]-p-anisidine with hypochlorous acid (HOCl), resulting in liberation of deuterated methanol. (B) Time-resolved 13C NMR spectra of a 1.7 mM solution of HP [13C,D3]-p-anisidine acquired every 4 seconds, using a 18° tip angle. The calculated T1 for this probe was 44.4 s (9.4 T, 37 °C). (C) 13C NMR spectrum of HP [13C,D3]-p-anisidine acquired 4 s after addition of HOCl (final concentration 20 mM), using a 90° tip angle. Adapted from ref. .
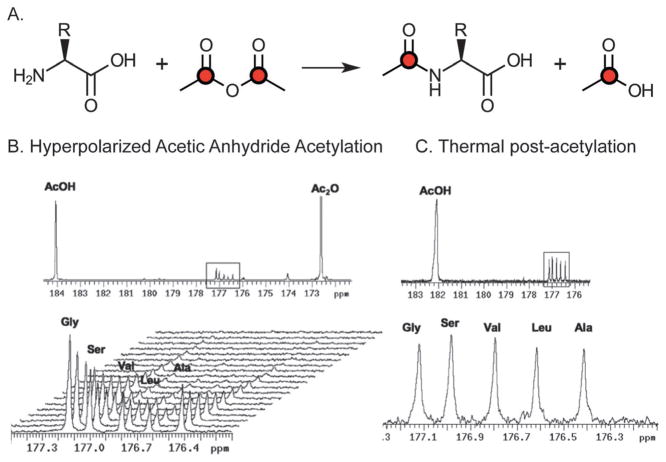
(A) General strategy for secondary hyperpolarization of amino acids using prepolarized [1,1-13C] acetic anhydride. Red dots indicate HP carbons. (B) HP spectrum obtained when a buffered solution (100 mM phosphate, pH 7.8) containing the amino acids gly, ser, val, leu, ala (3.5 mM amino acid) is reacted with a 2-fold excess of HP acetic anhydride at 11.7 T. (B, top) Full spectrum (t = 0) including large peaks corresponding to unreacted acetic anhydride and hydrolysis product acetic acid, and acetylated amino acid products (outlined). (B, bottom) Dynamic HP spectrum with resolved acetylated amino acid products. (C) Thermal spectrum corresponding to the HP data in B. (C, top) After addition of Magnevist Gd-chelate to a final concentration of 5 mM, the only peaks observed correspond to [1-13C] AcOH and the previously observed acetylated amino acid products (outlined). (C, bottom) Expanded region of interest in the 13C spectrum. Adapted from ref. .
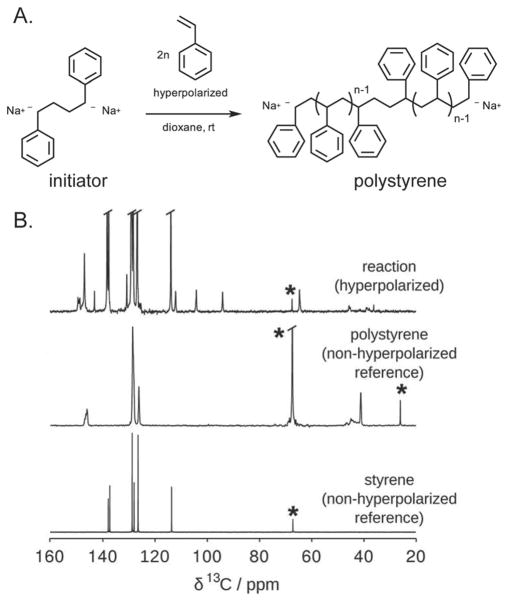
(A) Anionic polymerization using HP styrene. This scheme shows the propagation of polystyrene from bifunctional initiator in dioxane. (B) HP 13C NMR spectrum obtained when HP styrene is mixed with NaC10H8 initiator compared to the non-HP 13C spectra obtained for the synthesized polystyrene and for the styrene monomer. The * labels signify dioxane and THF resonances. A large number of peaks are observed in the HP 13C spectrum during polymer formation, which are not seen in the reference spectra obtained at thermal equilibrium. Correlation experiments with selective spin inversion were used to identify the chemical shifts of these reaction intermediates unambiguously. Adapted from ref. .
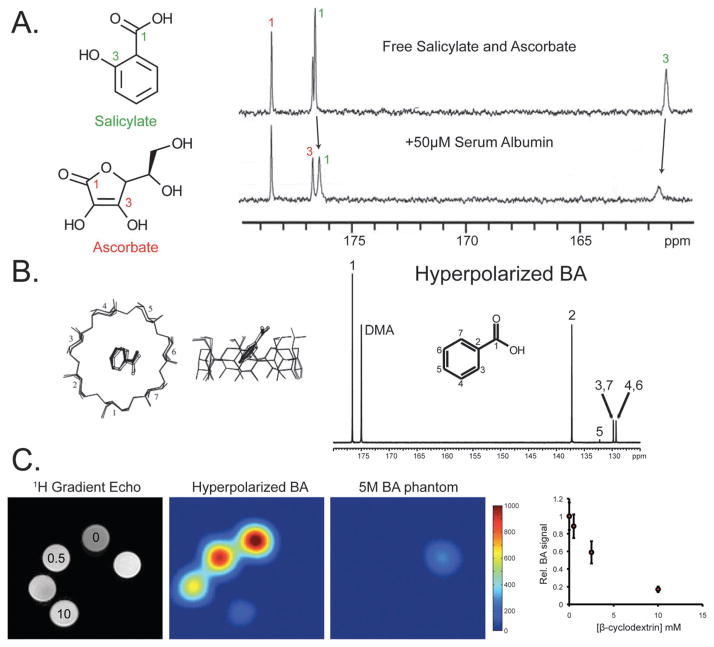
(A) Spectra of 200 mM HP salicylate and ascorbate at natural 13C isotopic abundance injected into buffer and into solutions of 50 mM human serum albumin at 9.4 T. Spectra are recorded 2 s after injections. 13C signals of the salicylate are detected in the binding reaction and show attenuated signal amplitude, line broadening and shift changes. Adapted from ref. . (B) Structure of the β-cyclodextrin–benzoic acid complex, as solved by X-ray crystallography and 13C NMR spectrum of natural abundance HP benzoic acid, obtained in a single 5° pulse at 36.4 mM (310 K, pH 7.8) at 11.7 T. All carbons are observed: C1-176.6 ppm, C2-137.3 ppm, C3,C7-129.8 ppm, C4,C6-129.3 ppm and C5-132.2 ppm. (C) HP 13C MR imaging experiment conducted at 14 T. (C, left) 1H imaging shows the orientation of tubes containing variable β-cyclodextrin concentration (0–10 mM final concentration). Also included is a [1-13C] benzoic acid phantom (5 M). The HP 13C MR imaging study was performed using a 3D frequency-selective sequence after administration of HP [1-13C] benzoic acid (final concentration 2.5 mM), and demonstrates loss of signal corresponding with increasing [β-cyclodextrin]. (C, right) Plot of HP [1-13C] benzoic acid MR signals observed with variable [β-cyclodextrin], quantified for the imaging experiment. Adapted from ref. .
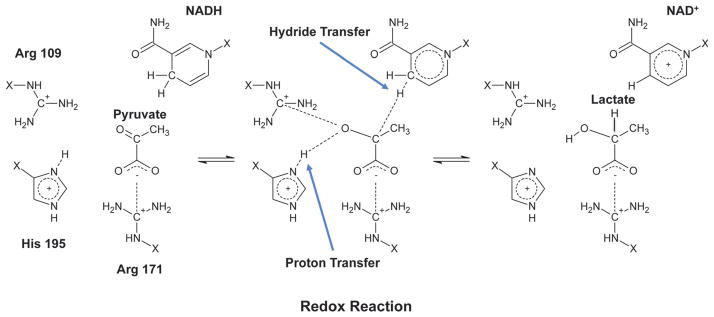
Lactate dehydrogenase (LDH) enzymatic conversion of pyruvate to lactate. The hydride transfer from nicotinamide adenine dinucleotide (NADH) is shown in the enzyme pocket. Amino acids are shown abbreviated with –X to simplify the scheme.
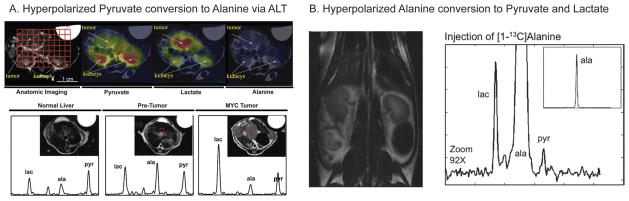
(A, top) HP images acquired post-injection of 80 mM [1-13C] pyruvate in a myc inducible transgenic model of liver cancer at 3 T. Color overlay maps from spectroscopic grids show clear differences in metabolic profiles between liver tumors and other tissues. (A, bottom) HP imaging of varying stages in tumor induction. Images demonstrate changes in metabolic profile during Myc-driven tumor formation. High pyruvate is detected in normal liver. Elevated alanine is associated with pretumor liver with modest MYC induction but no apparent phenotypic changes. A substantial increase in lactate is seen in developed tumor masses. Adapted from ref. . (B) T2-Weighted coronal image derived from a normal rat with corresponding representative 13C spectrum post-injection of [1-13C] alanine. Resonances corresponding to pyruvate and lactate are observed. Adapted from ref. .
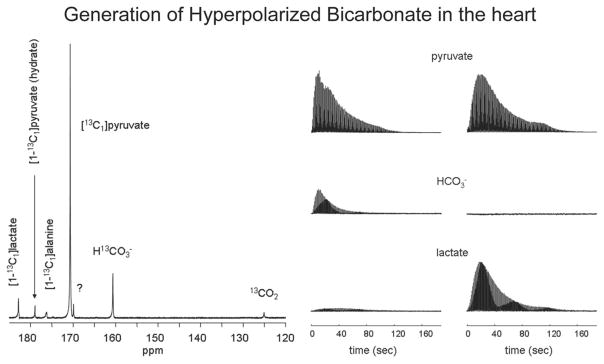
(left) 13C NMR spectrum of an isolated rat heart at 14 T. The summed spectrum (100 consecutive scans) demonstrates resonances for CO2, HCO3, pyruvate, lactate, alanine, and pyruvate hydrate. (right) Stacked plot of 13C NMR spectra from hearts supplied with [1-13C] pyruvate. Each resonance is a single scan showing the dynamic production of each metabolite. The left column is from a heart supplied with [1-13C] pyruvate, while the right was also incubated with octanoate. Adapted from ref. .
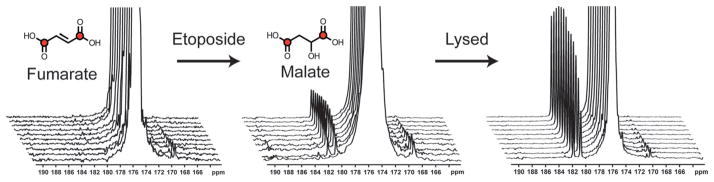
13C spectra acquired over a period of 1 min after injection of HP [1,4-13C2] fumarate into suspensions of intact murine lymphoma cells (5 × 10⁷ cells), cells treated with etoposide for 16 h and lysed cells. (B) Cells 16 h after etoposide treatment. Increased malate is observed with increased necrosis. Adapted from ref. .
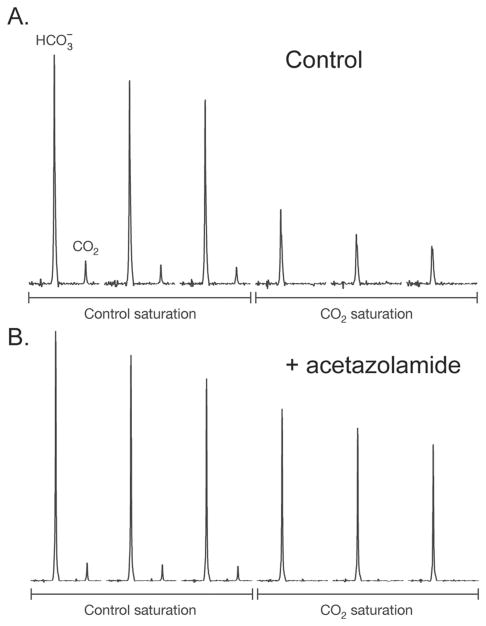
In vivo saturation experiment demonstrating that 13C HCO3− and 13C CO2 are in rapid chemical exchange, catalyzed by carbonic anhydrase. (A) Spectra acquired from a EL4 lymphoma tumor using a surface coil with a control saturation (first three spectra) and 13C CO2 saturation (second three spectra). (B) Identical experiment, but the mouse was treated with acetazolamide, a carbonic anhydrase inhibitor. Adapted from ref. .
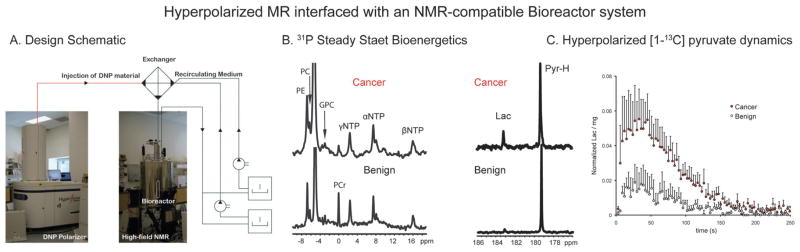
(A) Design schematic for NMR-compatible bioreactor system, including interface between a DNP polarizer and high-field NMR magnet (11.7 T). (B) 31P spectra from living human malignant and benign tissue slice cultures (TSCs) perfused in a 10 mm NMR-compatible bioreactor. (C) Representative single 13C spectrum taken at 90 s post-injection of HP [1-13C] pyruvate in the bioreactor with benign (N = 4) or malignant TSCs (N = 4) and accompanying average HP lactate dynamics for TSCs. Significantly increased lactate is observed in malignant prostate TSCs as compared to benign. PCr –phosphocreatine, PC – phosphocholine, PE – phosphoethanolamine, GPC – glycerophosphocholine, α,β,γ-NTPs – nucleotide triphosphates. Adapted from ref. .
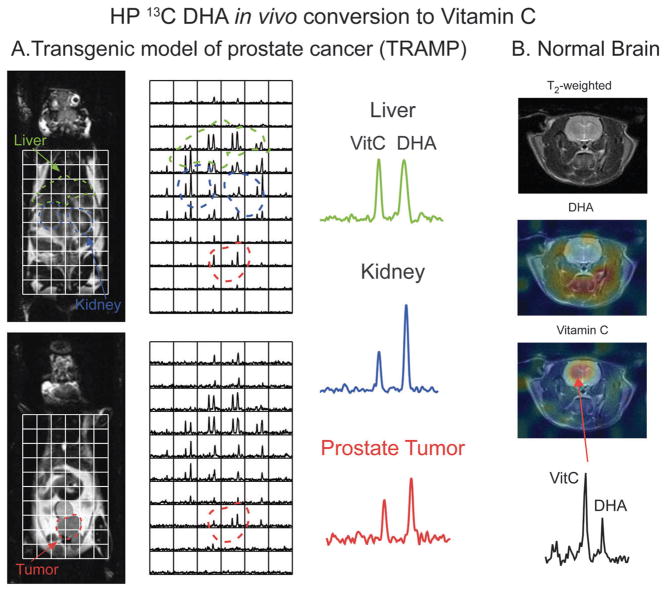
(A) Sequential coronal T2-weighted images and corresponding 13C 3D MRSI demonstrating distribution of HP DHA and vitamin C (VitC) in a TRAMP mouse post intravenous injection of 350 μL of 15 mM HP [1-13C] DHA at 3 T. The liver and kidneys are best seen in (A, top) and prostate tumor in (A, bottom), but both imaging slices contain significant amounts of liver, kidney, and tumor tissue. Regions of liver, kidney, and prostate tumor are segmented and superimposed on the spectral grid (color-coded dashed lines). Differences in metabolite ratios are seen between normal organs and between prostate tumor and normal surrounding tissues with representative spectra from liver, kidney, and prostate tumor. (B) Axial T2-weighted images and corresponding color overlays of HP DHA and vitamin C (VitC) signal in a normal rat brain. Adapted from ref. .
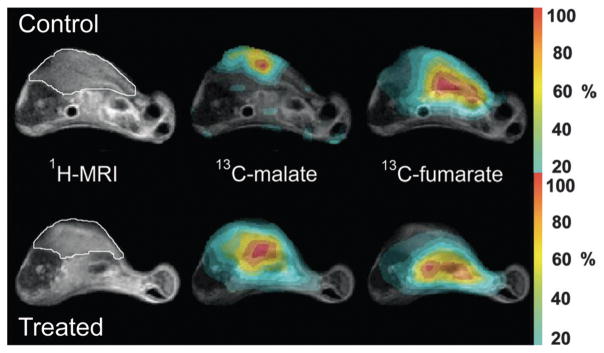
Representative axial images from untreated and etoposide-treated mice with implanted lymphoma tumors. Color overlays demonstrate increased total malate produced in etoposide treated mice in comparison to untreated tumors. Adapted from ref. .
References
-
- Thakur ML, Lentle BC. J Nucl Med. 2005;46:11N–13N. 42N. - PubMed
-
- Nelson SJ, Kurhanewicz J, Vigneron DB, Larson PE, Harzstark AL, Ferrone M, van Criekinge M, Chang JW, Bok R, Park I, Reed G, Carvajal L, Small EJ, Munster P, Weinberg VK, Ardenkjaer-Larsen JH, Chen AP, Hurd RE, Odegardstuen LI, Robb FJ, Tropp J, Murray JA. Sci Transl Med. 2013;5:198ra108. - PMC - PubMed
-
- Macovski A. J Magn Reson Imaging. 2009;30:919–923. - PubMed
-
- DeFeo EM, Wu CL, McDougal WS, Cheng LL. Nat Rev Urol. 2011;8:301–311. - PubMed
Publication types
MeSH terms
Substances
Grants and funding
LinkOut - more resources
Full Text Sources
Other Literature Sources
Medical
Miscellaneous