. 2013 Jul:15:10.1088/1367-2630/15/7/075006.
doi: 10.1088/1367-2630/15/7/075006.

Collective cell streams in epithelial monolayers depend on cell adhesion

Affiliations

Collective cell streams in epithelial monolayers depend on cell adhesion

András Czirók et al. New J Phys. 2013 Jul.

Abstract

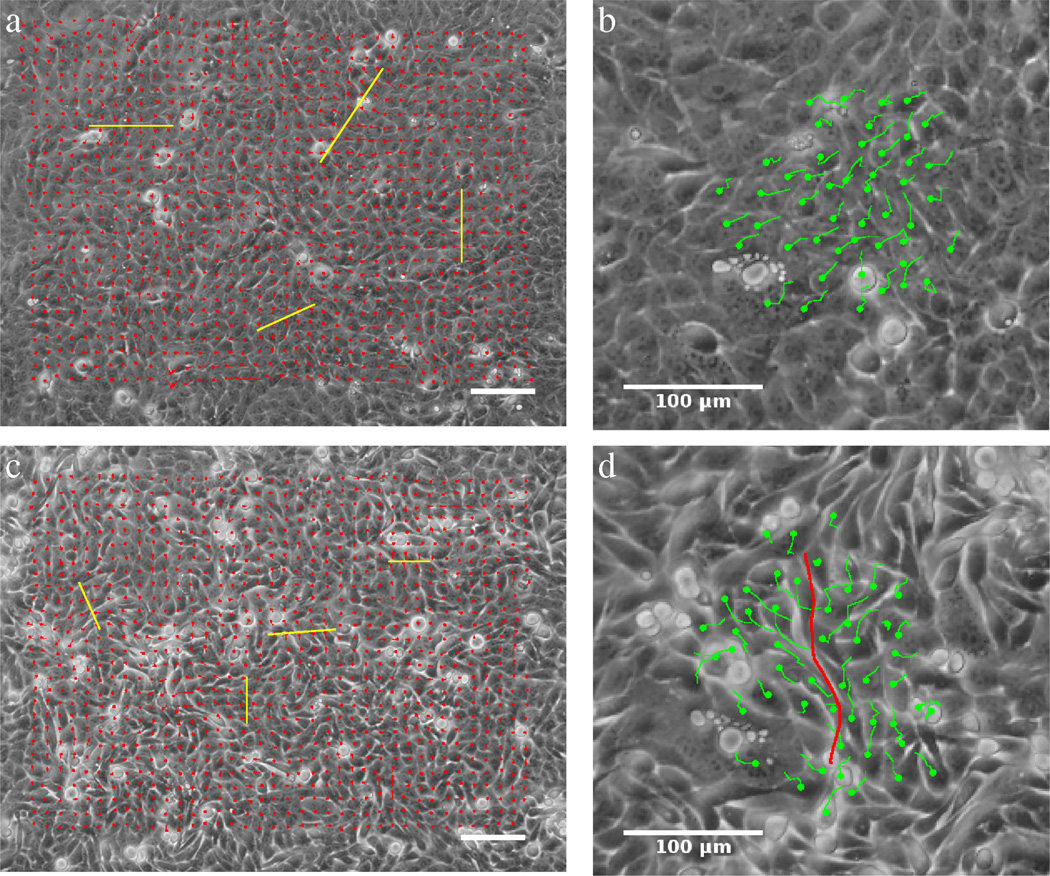
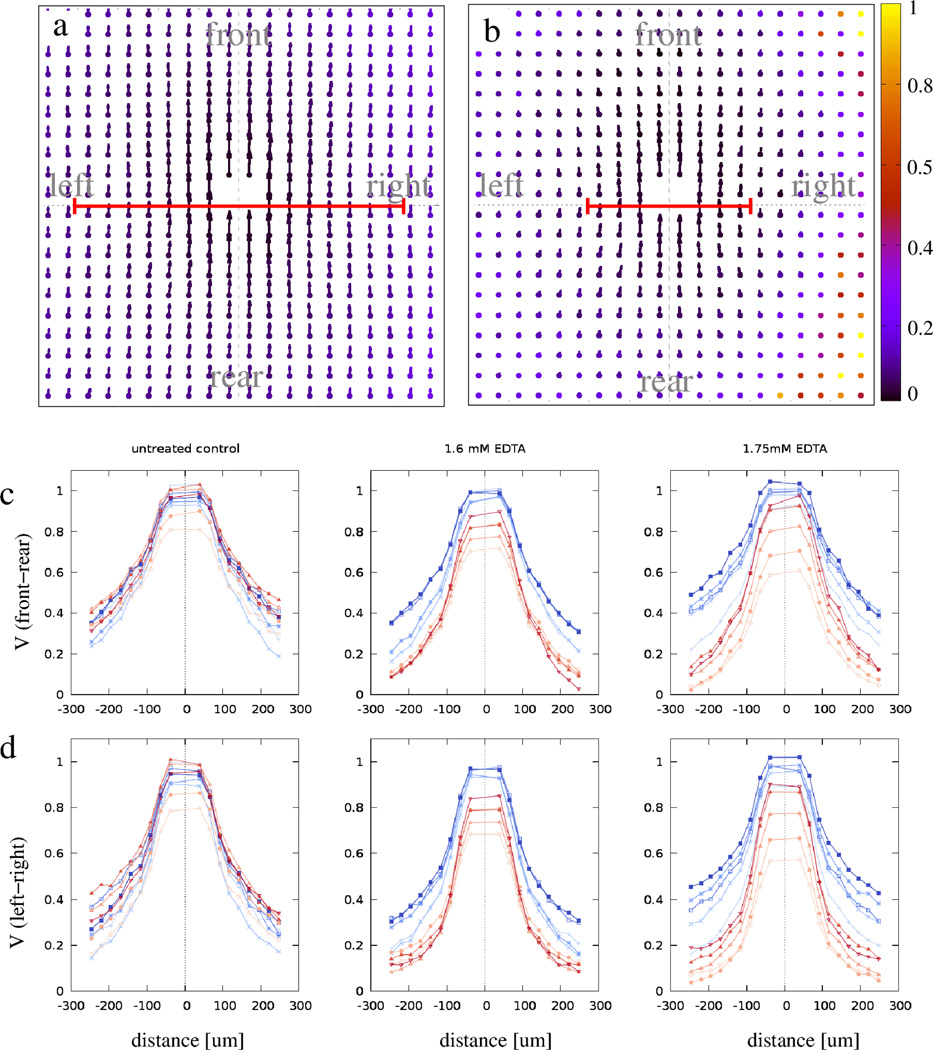
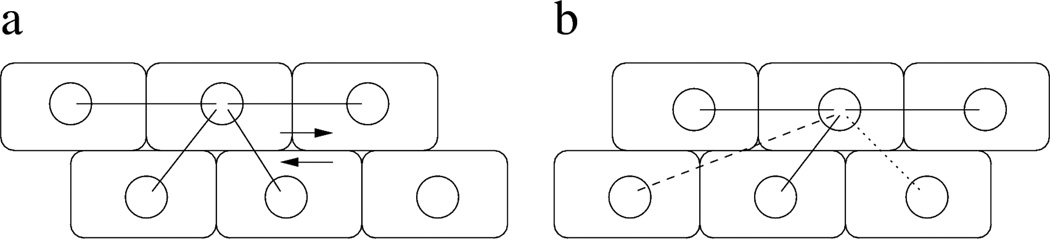
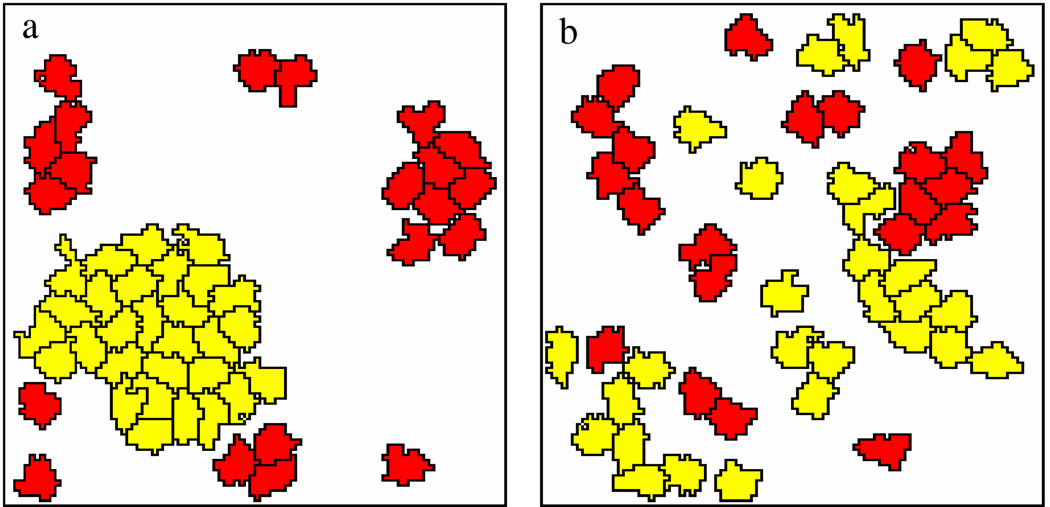
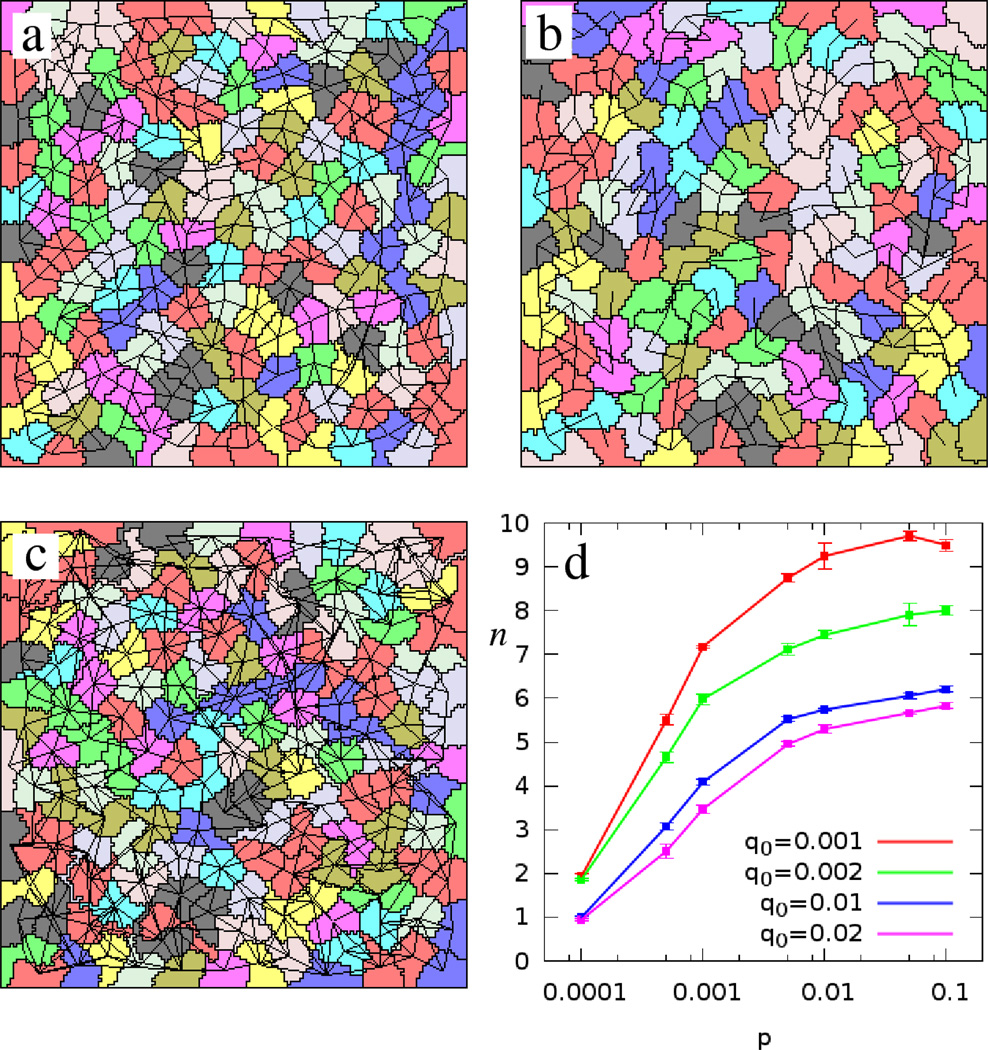
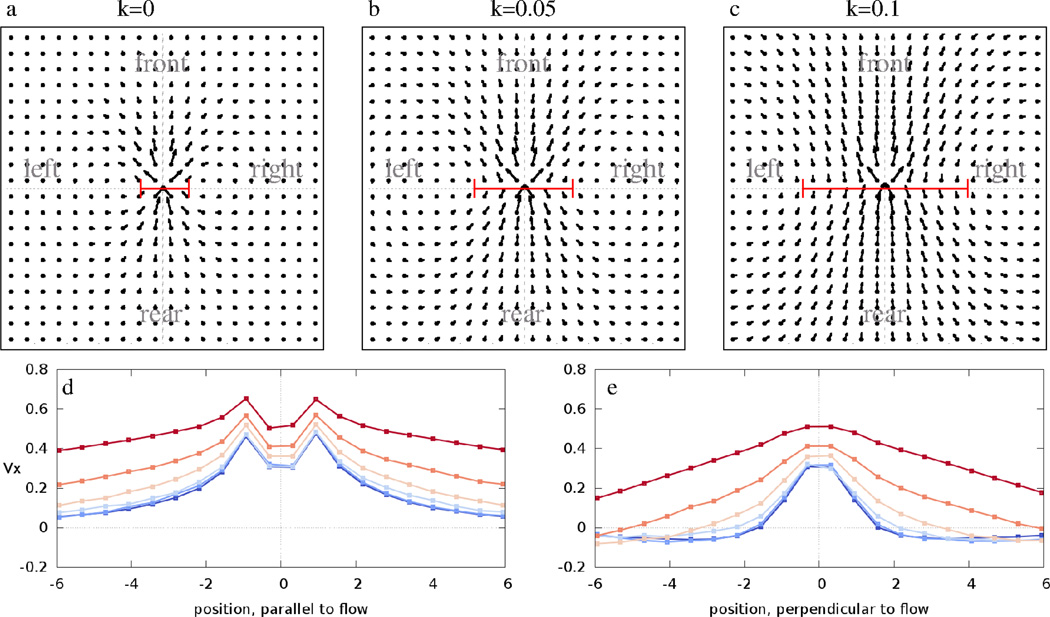
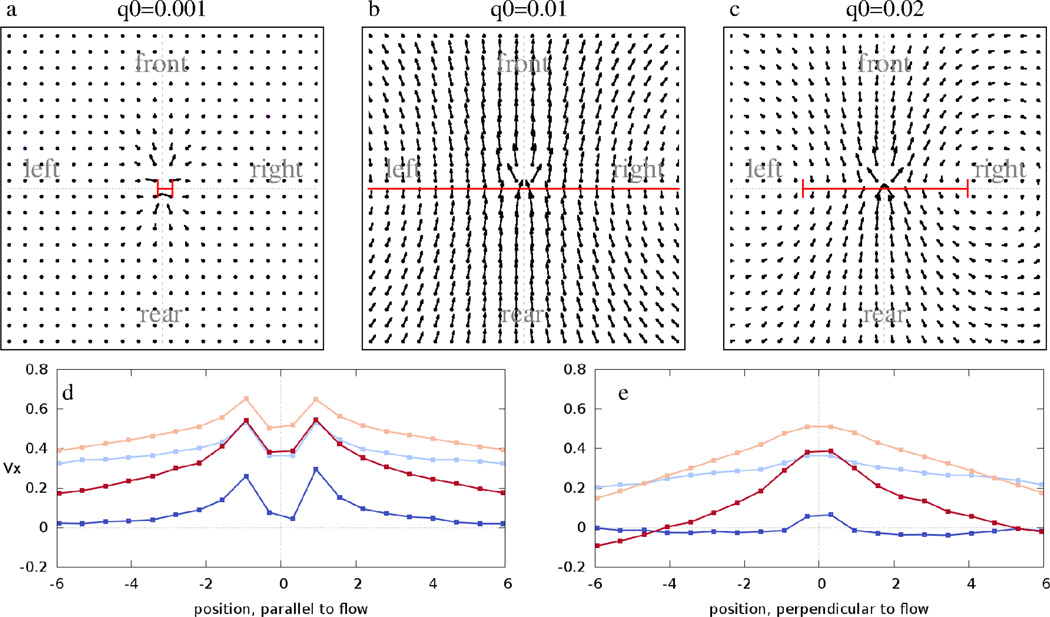
We report a spontaneously emerging, randomly oriented, collective streaming behavior within a monolayer culture of a human keratinocyte cell line, and explore the effect of modulating cell adhesions by perturbing the function of calcium-dependent cell adhesion molecules. We demonstrate that decreasing cell adhesion induces narrower and more anisotropic cell streams, reminiscent of decreasing the Taylor scale of turbulent liquids. To explain our empirical findings, we propose a cell-based model that represents the dual nature of cell-cell adhesions. Spring-like connections provide mechanical stability, while a cellular Potts model formalism represents surface-tension driven attachment. By changing the relevance and persistence of mechanical links between cells, we are able to explain the experimentally observed changes in emergent flow patterns.


Figures

Figure 1
Figure 1
Collective streaming of HaCaT cells in confluent monolayer cultures, in the absence (a,b) and presence (c,d) of the Ca2+ chelator EDTA. The locally prevalent direction of motion was determined by PIV analysis resulting in velocity fields (a,c) and also by manual tracking of cell centroids yielding trajectories of individual cells (b,d). Cells spontaneously form streams, whose widths (yellow bars on a,b) are reduced when free Ca2+ is removed from the medium. Adjacent cells moving in opposite directions are readily observed when cell adhesion is compromised (d, red line). Scale bars indicate 100 µm. See also Movies 1 and 3.
Figure 2
Figure 2
Average flow fields, V⃗ (x⃗), characterize cell motion around a typical motile cell. The color code indicates the local ratio between the statistical standard error and the magnitude of V⃗. Grid spacing is 25 µm; vectors visualize speeds as displacements extrapolated to a time interval of 100 minutes. In the presence of Ca2+, cells move in almost isotropic, wide streams (a). When cell-cell adhesions are perturbed by Ca2+ chelation, the flow field becomes more anisotropic as the correlation length is reduced more in the direction perpendicular to the flow (b). The average V⃗ (x⃗) values along the front-rear axis (panel c) and left-right axis (panel d) are plotted for various concentrations of EDTA. Blue and red colors indicate data obtained before and after EDTA treatment, respectively. Color saturation decreases with the time difference between data collection and EDTA perturbation. To compensate for a 20% variation across the cell cultures, values shown are normalized to the maximum of V⃗, obtained immediately before treatment. The red lines in panels a and b indicate stream widths, as obtained by an exponential fit of the velocity profiles shown in panel d.
Figure 3
Figure 3
Schematic representation of relative motion within a monolayer. Mechanical connection between cells are indicated by links drawn with solid lines. New connections between adjacent cells (dotted line) form with probability p. Contacts may remain between cells that are no longer adjacent (dashed line), but in each MCS break with a probability q(ℓ), proportional to the distance between the two cell centroids ℓ. This link dynamics results in more rearward connections when adjacent cell layers move in opposite directions.
Figure 4
Figure 4
Model simulations with (a) and without (b) cell-cell adhesion links. Motile (P = 1) and non-motile (P = 0) cells are represented in yellow and red, respectively. In the presence of cell-cell contacts, adhesive and motile cells aggregate into a single moving cluster. Parameters: α = 1, β = 0.5, p = 0.1, q0 = 10−3, k = 0.2. See also Movie 4.
Figure 5
Figure 5
Monolayer simulations with various bond dynamics parameters. Panel a shows a typical cell configuration using our standard set of parameter values: p = 10−3, q0 = 10−2 and k = 0.2. Decreasing p to p = 10−4 results in sparse connectivity (b). If the connections are maintained longer, such as in the choice of q0 = 10−3, the number of links between non adjacent cells increases (c). The average number of connections per cell (n) saturates with increasing p (d). Red, green, blue and violet colors indicate q0 values of 0.001, 0.002, 0.01 and 0.02, respectively.
Figure 6
Figure 6
Average flow fields V⃗ (x⃗) obtained from model simulations performed with p = 10−3, q0 = 10−2 and various weights, k, assigned to mechanical guidance. The grid spacing corresponds to r0/2, half of the target cell radius. In the absence of cell-cell contacts (k = 0, panel a) we recover the highly anisotropic, narrow streams reported previously for self-propelled CPM simulations and endothelial cultures [6]. As k increases, the width of the co-moving streams increases, as indicated by bars on panels a, b, and c. The average V⃗x values along the front-rear and left-right axis are plotted for various values of k in panels d and e, respectively. Distance is given in units of r0. Blue to red colors indicate k = 0, 0.01, 0.02, 0.05, 0.1 and 0.2, respectively. The red lines in panels a–c indicate stream widths, as obtained by an exponential fit of the velocity profiles shown in panel e. See also Movies 5–9.
Figure 7
Figure 7
Average flow fields V⃗ (x⃗) obtained from model simulations performed with p = 10−3, k = 0.2 and various values of q0. Data are presented as in Fig. 6. For long-lived contacts (q0 = 10−3, panel a) the system is frozen. For an intermediate stability of bonds (q0 = 0.01, panel b) the streams are wide. For faster contact turnover (q0 = 0.02, panel c) the streams become narrower and similar to the highly anisotropic flows characteristic for k = 0. The average Vx values along the front-rear and left-right axis are plotted for various values of q0 in panels d and e. Blue, light blue, orange and red colors indicate q0 = 0.001, 0.002, 0.01 and 0.02, respectively. See also Movies 9–11.

Similar articles

Cited by

References

    1. Montell DJ. Morphogenetic cell movements: diversity from modular mechanical properties. Science. 2008;322(5907):1502–1505. - PubMed
    1. Friedl P, Wolf K. Tube travel: the role of proteases in individual and collective cancer cell invasion. Cancer Res. 2008;68(18):7247–7249. - PubMed
    1. Haga H, Irahara C, Kobayashi R, Nakagaki T, Kawabata K. Collective movement of epithelial cells on a collagen gel substrate. Biophysical Journal. 2005;88(3):2250–2256. PMID: 15596493. - PMC - PubMed
    1. Angelini TE, Hannezo E, Trepat X, Fredberg JJ, Weitz DA. Cell migration driven by cooperative substrate deformation patterns. Phys Rev Lett. 2010 Apr;104:168104. - PMC - PubMed
    1. Vitorino P, Meyer T. Modular control of endothelial sheet migration. Genes Dev. 2008;22(23):3268–3281. - PMC - PubMed

LinkOut - more resources