

The diffeomorphometry of temporal lobe structures in preclinical Alzheimer's disease
- PMID: 24363990
- PMCID: PMC3863771
- DOI: 10.1016/j.nicl.2013.09.001
The diffeomorphometry of temporal lobe structures in preclinical Alzheimer's disease
Abstract
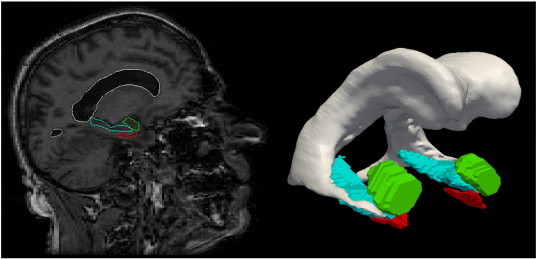
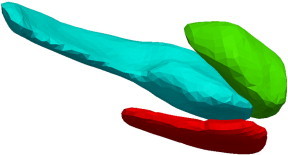
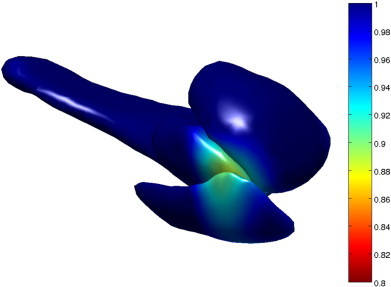
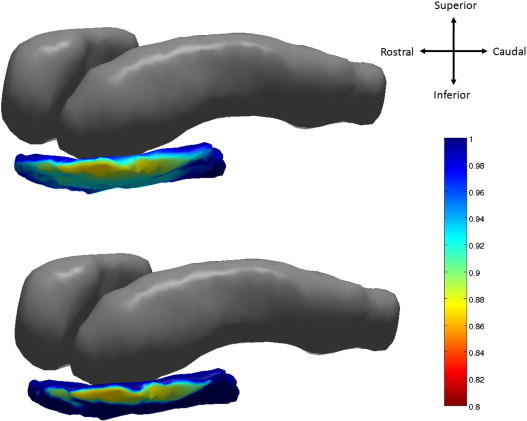
This paper examines morphometry of MRI biomarkers derived from the network of temporal lobe structures including the amygdala, entorhinal cortex and hippocampus in subjects with preclinical Alzheimer's disease (AD). Based on template-centered population analysis, it is demonstrated that the structural markers of the amygdala, hippocampus and entorhinal cortex are statistically significantly different between controls and those with preclinical AD. Entorhinal cortex is the most strongly significant based on the linear effects model (p < .0001) for the high-dimensional vertex- and Laplacian-based markers corresponding to localized atrophy. The hippocampus also shows significant localized high-dimensional change (p < .0025) and the amygdala demonstrates more global change signaled by the strength of the low-dimensional volume markers. The analysis of the three structures also demonstrates that the volume measures are only weakly discriminating between preclinical and control groups, with the average atrophy rates of the volume of the entorhinal cortex higher than amygdala and hippocampus. The entorhinal cortex thickness also exhibits an atrophy rate nearly a factor of two higher in the ApoE4 positive group relative to the ApoE4 negative group providing weak discrimination between the two groups.
Figures
References
-
- Arnold S.E., Hyman B.T., Flory J., Damasio A.R., Van Hoesen G.W. The topographical and neuroanatomical distribution of neurofibrillary tangles and neuritic plaques in the cerebral cortex of patients with Alzheimer's disease. Cereb. Cortex. 1991;1:103–116. - PubMed
-
- Arriagada P.V., Growdon J.H., Hedley-Whyte E.T., Hyman B.T. Neurofibrillary tangles but not senile plaques parallel duration and severity of Alzheimer's disease. Neurology. 1992;42:631–639. - PubMed
-
- Ashburner J., Csernansky J.G., Davatzikos C., Fox N.C., Frisoni G.B., Thompson P.M. Computer-assisted imaging to assess brain structure in healthy and diseased brains. Lancet Neurol. 2003;2:79–88. - PubMed
-
- Beg M.F., Miller M.I., Trouv\'E A., Younes L. Computing metrics via geodesics on flows of diffeomorphisms. Int. J. Comput. Vis. 2005;61:139–157.
Grants and funding
LinkOut - more resources
Full Text Sources
Other Literature Sources
