Review
. 2013 Nov 16:4:98-111.
doi: 10.1016/j.nicl.2013.11.002. eCollection 2014.

Dissecting psychiatric spectrum disorders by generative embedding

Affiliations
Review

Dissecting psychiatric spectrum disorders by generative embedding

Kay H Brodersen et al. Neuroimage Clin. .

Abstract

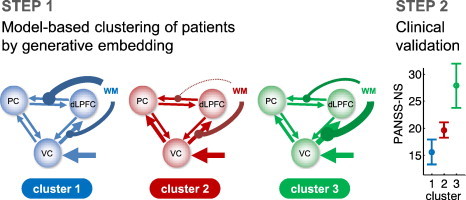
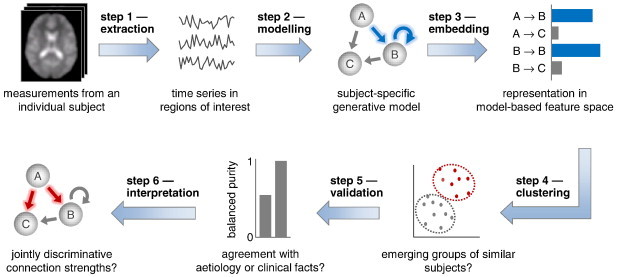
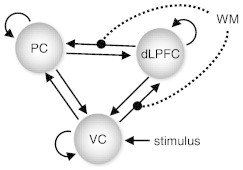
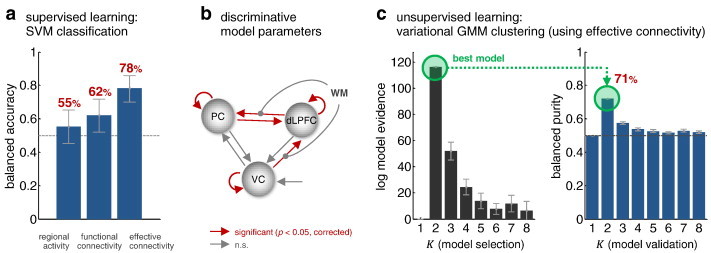
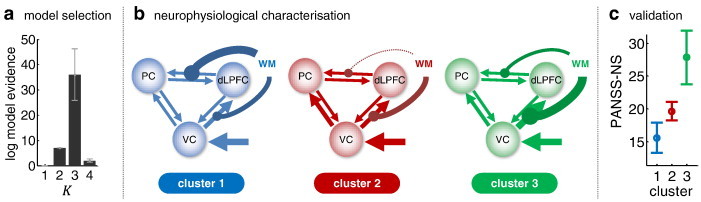
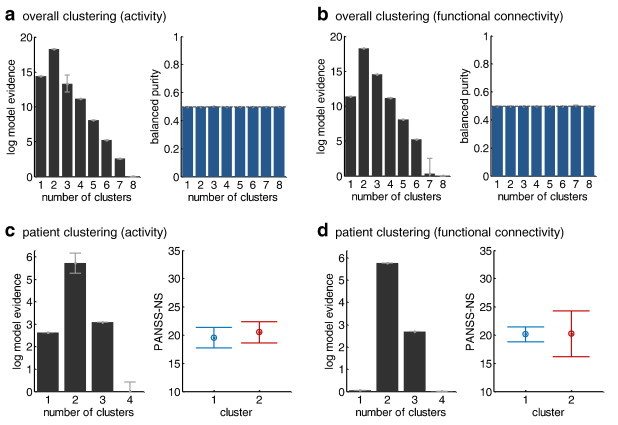
This proof-of-concept study examines the feasibility of defining subgroups in psychiatric spectrum disorders by generative embedding, using dynamical system models which infer neuronal circuit mechanisms from neuroimaging data. To this end, we re-analysed an fMRI dataset of 41 patients diagnosed with schizophrenia and 42 healthy controls performing a numerical n-back working-memory task. In our generative-embedding approach, we used parameter estimates from a dynamic causal model (DCM) of a visual-parietal-prefrontal network to define a model-based feature space for the subsequent application of supervised and unsupervised learning techniques. First, using a linear support vector machine for classification, we were able to predict individual diagnostic labels significantly more accurately (78%) from DCM-based effective connectivity estimates than from functional connectivity between (62%) or local activity within the same regions (55%). Second, an unsupervised approach based on variational Bayesian Gaussian mixture modelling provided evidence for two clusters which mapped onto patients and controls with nearly the same accuracy (71%) as the supervised approach. Finally, when restricting the analysis only to the patients, Gaussian mixture modelling suggested the existence of three patient subgroups, each of which was characterised by a different architecture of the visual-parietal-prefrontal working-memory network. Critically, even though this analysis did not have access to information about the patients' clinical symptoms, the three neurophysiologically defined subgroups mapped onto three clinically distinct subgroups, distinguished by significant differences in negative symptom severity, as assessed on the Positive and Negative Syndrome Scale (PANSS). In summary, this study provides a concrete example of how psychiatric spectrum diseases may be split into subgroups that are defined in terms of neurophysiological mechanisms specified by a generative model of network dynamics such as DCM. The results corroborate our previous findings in stroke patients that generative embedding, compared to analyses of more conventional measures such as functional connectivity or regional activity, can significantly enhance both the interpretability and performance of computational approaches to clinical classification.

Keywords: Balanced purity; Clinical validation; Clustering; Schizophrenia; Variational Bayes.


Figures

None
Graphical abstract
Fig. 1
Fig. 1
Conceptual overview of model-based clustering by generative embedding. This schematic illustrates how generative embedding enables model-based clustering of fMRI data. First, separately for each subject, BOLD time series are extracted from a number of regions of interest. Second, subject-specific time series are used to estimate the parameters of a generative model. Third, subjects are embedded in a generative score space in which each dimension represents a specific model parameter. This space implies a similarity metric under which any two subjects can be compared. Fourth, a clustering algorithm is used to identify salient substructures in the data. Fifth, the resulting clusters are validated against known external (clinical) variables. Once validated, a clustering solution can, sixth, be interpreted mechanistically in the context of the underlying generative model.
Fig. 2
Fig. 2
Options for network construction for generative embedding. An important design decision in model-based clustering analyses is the criterion by which regional time series are extracted from the data. One option is to define regions anatomically, followed by the separate inversion of the model for each subject. A clustering solution obtained in this way can be safely evaluated with respect to an external variable (Procedure a). A frequent alternative is to define regions in terms of a functional contrast. As before, models are inverted in a subject-by-subject fashion (Procedure b). This allows for an unbiased estimate of the external validity of the resulting clustering solution but requires, critically, that the functional contrast not be based on the same variable that is used for external validation (Procedure c).
Fig. 3
Fig. 3
The dynamic causal model that was chosen as a basis for generative embedding. This figure summarises the structure of the three-region DCM suggested by Deserno et al. (2012). The model consists of visual, parietal, and prefrontal regions. Trial-specific visual information is modelled to provide driving input for visual cortex, whereas working-memory demands (2-back condition) are allowed to alter the strength of visual–prefrontal and prefrontal–parietal connections.
Fig. 4
Fig. 4
Model-based classification and clustering of all subjects. Fig. 4a shows the result of a supervised classification analysis under 5-fold cross-validation. It can be seen that schizophrenic patients can be best distinguished from healthy controls using generative embedding; this performance was significantly higher compared to classification based on functional connectivity or regional activity (see main text for details). Panel b illustrates which model parameters differed significantly between patients and controls (two-sample t-tests on individual model parameters with Bonferroni correction for multiple tests), thus contributing most strongly to the classification result. Panel c reports the results of an unsupervised analysis, using a variational Bayesian Gaussian mixture model that operates on DCM parameter estimates. This analysis finds the highest evidence for a model consisting of two clusters. These two clusters correspond to patient and control groups with almost the same accuracy as the supervised classification analysis (see main text for details).
Fig. 5
Fig. 5
Model-based clustering (generative embedding) of patients. This figure summarises the results of an unsupervised clustering analysis of the patient group only, using Gaussian mixture models operating on DCM parameter estimates. Panel a plots the log evidence for models assuming different numbers of clusters, showing that there is highest evidence for three subgroups of schizophrenic patients. Panel b summarises the average posterior parameter estimates (in terms of maximum a posteriori estimates) for each coupling and input parameter in the model. This is displayed graphically by the width of the respective arrows. Panel c demonstrates that the three subgroups, which are defined on the basis of connection strengths, also differ in terms of negative clinical symptoms as operationalised by the negative symptoms (NS) subscale of the PANSS score.
Fig. 6
Fig. 6
Clustering solutions based on regional activity or functional connectivity. Panels (a) and (b) report the results of repeating the unsupervised clustering analysis of all subjects (cf. Fig. 4c), using estimates of regional activity and functional connectivity, respectively. In contrast to the procedure based on generative embedding, using regional activity and functional connectivity as data features provided weaker relative evidence for two clusters, and these two clusters did not map onto patients and controls (balanced purity insignificantly different from 0.5). Panels (c) and (d) show the results of a clustering analysis of patients only (cf. Fig. 5), using regional activity and functional connectivity. In contrast to the generative-embedding solution, these analyses suggest the existence of two (as opposed to three) patient subgroups. However, in neither case did the suggested subgroups map onto significant differences in clinical symptoms as measured by the PANSS score.

References

    1. Allardyce J., McCreadie R.G., Morrison G., van Os J. Do symptom dimensions or categorical diagnoses best discriminate between known risk factors for psychosis? Soc. Psychiatry Psychiatr. Epidemiol. 2007;42(6):429–437. - PMC - PubMed
    1. Attias H. A variational Bayesian framework for graphical models. Adv. Neural Inf. Process. Syst. 2000;12(1–2):209–215.
    1. Barch D.M., Carter C.S., Dakin S.C., Gold J., Luck S.J., MacDonald A., Strauss M.E. The clinical translation of a measure of gain control: the contrast–contrast effect task. Schizophr. Bull. 2012;38(1):135–143. - PMC - PubMed
    1. Barr M.S., Farzan F., Tran L.C., Chen R., Fitzgerald P.B., Daskalakis Z.J. Evidence for excessive frontal evoked gamma oscillatory activity in schizophrenia during working memory. Schizophr. Res. 2010;121(1–3):146–152. - PubMed
    1. Bishop C.M. Springer New York; 2007. Pattern Recognition and Machine Learning.

Publication types