Modeling and Simulation of Intracellular Drug Transport and Disposition Pathways with Virtual Cell
- PMID: 24364041
- PMCID: PMC3869409
- DOI: 10.13188/2327-204X.1000004
Modeling and Simulation of Intracellular Drug Transport and Disposition Pathways with Virtual Cell
Abstract
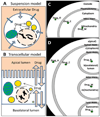
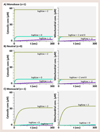
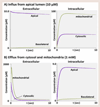
The development of computational approaches for modeling the spatiotemporal dynamics of intracellular, small molecule drug concentrations has become an increasingly important area of pharmaceutical research. For systems pharmacology, the system dynamics of subcellular transport can be coupled to downstream pharmacological effects on biochemical pathways that impact cell structure and function. Here, we demonstrate how a widely used systems biology modeling package - Virtual Cell - can also be used to model the intracellular, passive transport pathways of small druglike molecules. Using differential equations to represent passive drug transport across cellular membranes, spatiotemporal changes in the intracellular distribution and concentrations of exogenous chemical agents in specific subcellular organelles were simulated for weakly acidic, neutral, and basic molecules, as a function of the molecules' lipophilicity and ionization potentials. In addition, we simulated the transport properties of small molecule chemical agents in the presence of a homogenous extracellular concentration or a transcellular concentration gradient. We also simulated the effects of cell type-dependent variations in the intracellular microenvironments on the distribution and accumulation of small molecule chemical agents in different organelles over time, under influx and efflux conditions. Lastly, we simulated the transcellular transport of small molecule chemical agents, in the presence of different apical and basolateral microenvironments. By incorporating existing models of drug permeation and subcellular distribution, our results indicate that Virtual Cell can provide a user-friendly, open, online computational modeling platform for systems pharmacology and biopharmaceutics research, making mathematical models and simulation results accessible to a broad community of users, without requiring advanced computer programming knowledge.
Keywords: Computational Biology; Drug Disposition; Pharmacokinetics; Pharmacology; Simulation and Modeling; Systems Biology; Systems Pharmacology; Virtual Cell.
Figures


Similar articles
-
Computational approaches to analyse and predict small molecule transport and distribution at cellular and subcellular levels.Biopharm Drug Dispos. 2014 Jan;35(1):15-32. doi: 10.1002/bdd.1879. Epub 2013 Dec 10. Biopharm Drug Dispos. 2014. PMID: 24218242 Free PMC article. Review.
-
Simulation-based cheminformatic analysis of organelle-targeted molecules: lysosomotropic monobasic amines.J Comput Aided Mol Des. 2008 Sep;22(9):629-45. doi: 10.1007/s10822-008-9194-7. Epub 2008 Mar 13. J Comput Aided Mol Des. 2008. PMID: 18338229 Free PMC article.
-
Cells on pores: a simulation-driven analysis of transcellular small molecule transport.Mol Pharm. 2010 Apr 5;7(2):456-67. doi: 10.1021/mp9001969. Mol Pharm. 2010. PMID: 20025248 Free PMC article.
-
The subcellular distribution of small molecules: from pharmacokinetics to synthetic biology.Mol Pharm. 2011 Oct 3;8(5):1619-28. doi: 10.1021/mp200092v. Epub 2011 Aug 15. Mol Pharm. 2011. PMID: 21805990 Free PMC article. Review.
-
Quantitative Raman chemical imaging of intracellular drug-membrane aggregates and small molecule drug precipitates in cytoplasmic organelles.Adv Drug Deliv Rev. 2023 Nov;202:115107. doi: 10.1016/j.addr.2023.115107. Epub 2023 Sep 26. Adv Drug Deliv Rev. 2023. PMID: 37769851 Free PMC article. Review.
Cited by
-
In silico prediction of chemical subcellular localization via multi-classification methods.Medchemcomm. 2017 Mar 29;8(6):1225-1234. doi: 10.1039/c7md00074j. eCollection 2017 Jun 1. Medchemcomm. 2017. PMID: 30108833 Free PMC article.
-
Computational approaches to analyse and predict small molecule transport and distribution at cellular and subcellular levels.Biopharm Drug Dispos. 2014 Jan;35(1):15-32. doi: 10.1002/bdd.1879. Epub 2013 Dec 10. Biopharm Drug Dispos. 2014. PMID: 24218242 Free PMC article. Review.
References
-
- Eddershaw PJ, Beresford AP, Bayliss MK. ADME/PK as part of a rational approach to drug discovery. Drug Discov Today. 2000;5:409–414. - PubMed
-
- Yamashita F, Hashida M. In silico approaches for predicting ADME properties of drugs. Drug Metab Pharmacokinet. 2004;19:327–338. - PubMed
-
- Sun D, Yu LX, Hussain MA, Wall DA, Smith RL, et al. In vitro testing of drug absorption for drug ‘developability’ assessment: forming an interface between in vitro preclinical data and clinical outcome. Curr Opin Drug Discov Devel. 2004;7:75–85. - PubMed
-
- Rashid F, Horobin RW. Interaction of molecular probes with living cells and tissues. Part 2. A structure-activity analysis of mitochondrial staining by cationic probes, and a discussion of the synergistic nature of image-based and biochemical approaches. Histochemistry. 1990;94(3):303–308. - PubMed
Grants and funding
LinkOut - more resources
Full Text Sources
Other Literature Sources
