

Determination of French influenza outbreaks periods between 1985 and 2011 through a web-based Delphi method
- PMID: 24364926
- PMCID: PMC3898022
- DOI: 10.1186/1472-6947-13-138
Determination of French influenza outbreaks periods between 1985 and 2011 through a web-based Delphi method
Abstract
Background: Assessing the accuracy of influenza epidemic periods determined by statistical models is important to improve the performance of algorithms used in real-time syndromic surveillance systems. This is a difficult problem to address in the absence of a reliable gold standard. The objective of this study is to establish an expert-based determination of the start and the end of influenza epidemics in France.
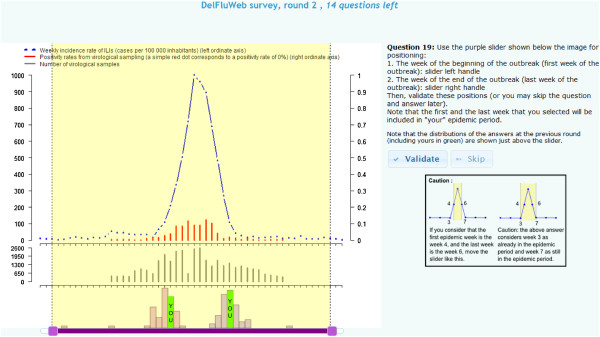
Methods: A three-round international web-based Delphi survey was proposed to 288 eligible influenza experts. Fifty-seven (20%) experts completed the three-rounds of the study. The experts were invited to indicate the starting and the ending week of influenza epidemics, on 32 time-series graphs of influenza seasons drawn using data from the French Sentinelles Network (Influenza-like illness incidence rates) and virological data from the WHO-FluNet. Twenty-six of 32 time-series graphs proposed corresponded to each of the French influenza seasons observed between 1985 and 2011. Six influenza seasons were proposed twice at each round to measure variation among expert responses.
Results: We obtained consensual results for 88% (23/26) of the epidemic periods. In two or three rounds (depending on the season) answers gathered around modes, and the internal control demonstrated a good reproducibility of the answers. Virological data did not appear to have a significant impact on the answers or the level of consensus, except for a season with a major mismatch between virological and incidence data timings.
Conclusions: Thanks to this international web-based Delphi survey, we obtained reproducible, stable and consensual results for the majority of the French influenza epidemic curves analysed. The detailed curves together with the estimates from the Delphi study could be a helpful tool for assessing the performance of statistical outbreak detection methods, in order to optimize them.
Figures


References
-
- Flahault A, Blanchon T, Dorleans Y, Toubiana L, Vibert JF, Valleron AJ. Virtual surveillance of communicable diseases: a 20-year experience in France. Stat Methods Med Res. 2006;13(5):413–421. - PubMed
MeSH terms
LinkOut - more resources
Full Text Sources
Other Literature Sources
Medical
