. 2013 Dec 24:14:918.
doi: 10.1186/1471-2164-14-918.

POMO--Plotting Omics analysis results for Multiple Organisms

Affiliations

POMO--Plotting Omics analysis results for Multiple Organisms

Jake Lin et al. BMC Genomics. .

Abstract

Background: Systems biology experiments studying different topics and organisms produce thousands of data values across different types of genomic data. Further, data mining analyses are yielding ranked and heterogeneous results and association networks distributed over the entire genome. The visualization of these results is often difficult and standalone web tools allowing for custom inputs and dynamic filtering are limited.

Results: We have developed POMO (http://pomo.cs.tut.fi), an interactive web-based application to visually explore omics data analysis results and associations in circular, network and grid views. The circular graph represents the chromosome lengths as perimeter segments, as a reference outer ring, such as cytoband for human. The inner arcs between nodes represent the uploaded network. Further, multiple annotation rings, for example depiction of gene copy number changes, can be uploaded as text files and represented as bar, histogram or heatmap rings. POMO has built-in references for human, mouse, nematode, fly, yeast, zebrafish, rice, tomato, Arabidopsis, and Escherichia coli. In addition, POMO provides custom options that allow integrated plotting of unsupported strains or closely related species associations, such as human and mouse orthologs or two yeast wild types, studied together within a single analysis. The web application also supports interactive label and weight filtering. Every iterative filtered result in POMO can be exported as image file and text file for sharing or direct future input.

Conclusions: The POMO web application is a unique tool for omics data analysis, which can be used to visualize and filter the genome-wide networks in the context of chromosomal locations as well as multiple network layouts. With the several illustration and filtering options the tool supports the analysis and visualization of any heterogeneous omics data analysis association results for many organisms. POMO is freely available and does not require any installation or registration.


Figures

Figure 1
Figure 1
POMO flow chart. When using POMO, first the user selects the organism he wants to study. It is also possible to create a custom organism. Second, user uploads the associations and possible annotations as data inputs into POMO. Currently, POMO is supporting 10 different genomes. POMO visualizes the input associations instantly providing multiple options for the views. The weights and labels, including gene sets, such as pathways, can be applied for filtering. All views are exportable as figures and also as text formats which can be directly used as future inputs.
Figure 2
Figure 2
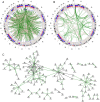
Illustration of copy number alterations and gene expression value associations in hESC and hiPSC samples. The figures depict associations detected in human embryonic (hESC) and induced pluripotent stem cell (hiPSC) data and associations with colored based on the correlation value. The file has 45,791 edges and the upload and plotting took 5 seconds. A) POMO illustration of the best 2000 correlations shows 2000 edges and with heatmap rings hiPSC/hESC expressing high/low gene expression with CNV gain and loss. Green edges indicate positive correlations while pink indicates negative. B) The result is further filtered using set membership check on the gene list taken from KEGG WNT pathway and the edge weight abs (correlation) > = 0.92, yielding 160 edges. C) The result in sub-Figure B is illustrated with the Cytoscape Web radial layout.
Figure 3
Figure 3
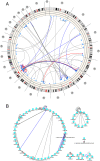
Plotting genomic structural variations. The figures depict TCGA GBM [43,44] rearrangements and chromothripsis findings from whole genome sequencing. A) Edge colors are used to describe number of supporting reads, with gray < 50 and blue greater than 100. Histogram rings are depicting copy number gain and loss ratios while the inner most ring accounts for possible gene fusion events. B) The result is showing the network view of the same data where the single edge associations are filtered.
Figure 4
Figure 4
Mouse-human phenolog homology and custom alga network views. A) Genome-wide visualization of mouse-human obesity ortholog associations. Blue perimeter stands for mouse while purple is for human, blue edges stand predicted mouse orthologs based on shared human phenotype while red edges indicate ortholog groups shared by human and mouse phenotypes. B) Figure shows the chloroplast genome of Chlamydomonas reinhardtii (NC_005353) highlighting the chloroplastic part of the cyt b6f complex where its nodes and edges consist of the genes petA, petD, petB, petG, and petL.

References

    1. Kircher M, Kelso J. High-throughput DNA sequencing – concepts and limitations. Bioessays. 2010;14:524–536. doi: 10.1002/bies.200900181. - DOI - PubMed
    1. Schatz MC, Langmead B, Salzberg SL. Cloud computing and the DNA data race. Nat Biotechnol. 2010;14:691–693. doi: 10.1038/nbt0710-691. - DOI - PMC - PubMed
    1. Berger B, Peng J, Singh M. Computational solutions for omics data. Nat Rev Genet. 2013;14:333–346. doi: 10.1038/nrg3433. - DOI - PMC - PubMed
    1. Palsson B, Zengler K. The challenges of integrating multi-omic data sets. Nat Chem Biol. 2010;14:787–789. - PubMed
    1. Kirwan GM, Johansson E, Kleemann R, Verheij ER, Wheelock ÅM, Goto S, Trygg J, Wheelock CE. Building multivariate systems biology models. Anal Chem. 2012;14:7064–7071. doi: 10.1021/ac301269r. - DOI - PubMed

Publication types