. 2015 Feb;20(1):126-32.
doi: 10.1038/mp.2013.174. Epub 2013 Dec 24.

Autophagy has a key role in the pathophysiology of schizophrenia

Affiliations
Free PMC article

Autophagy has a key role in the pathophysiology of schizophrenia

A Merenlender-Wagner et al. Mol Psychiatry. 2015 Feb.
Free PMC article

Abstract

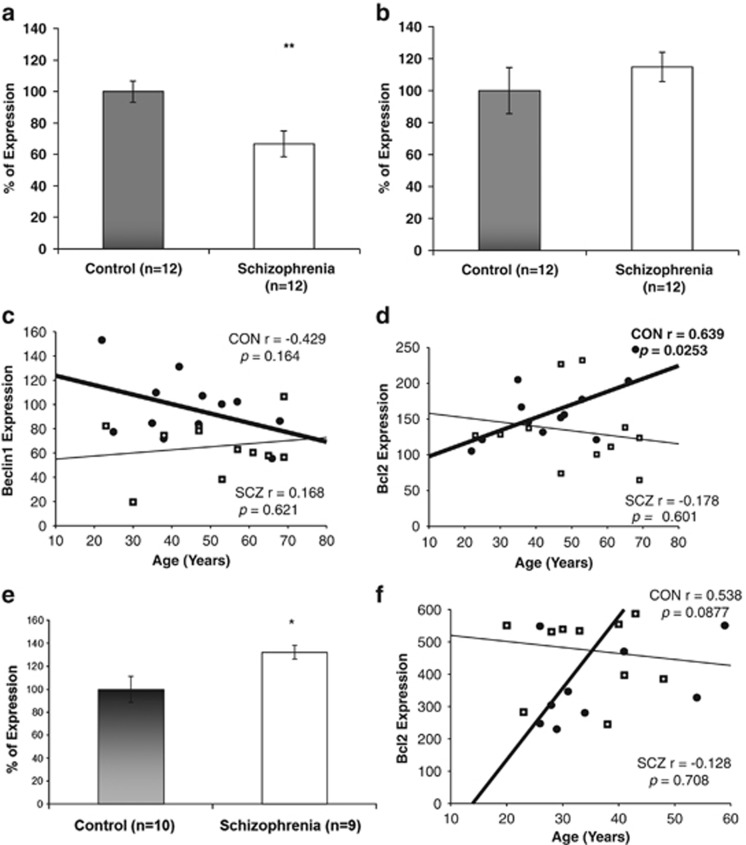
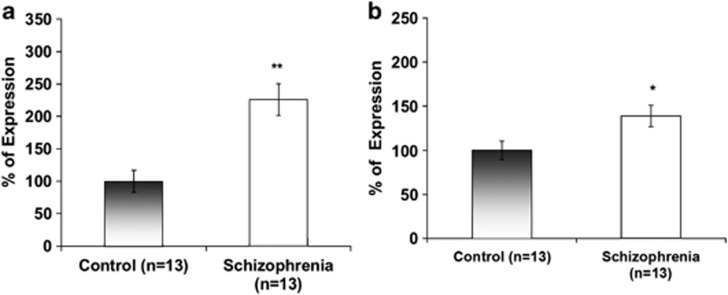
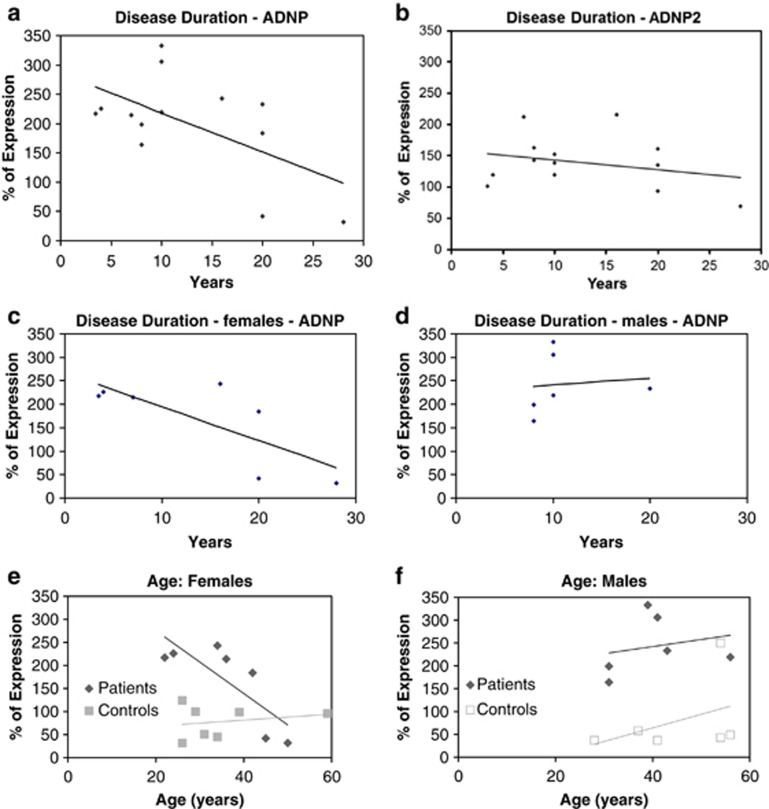
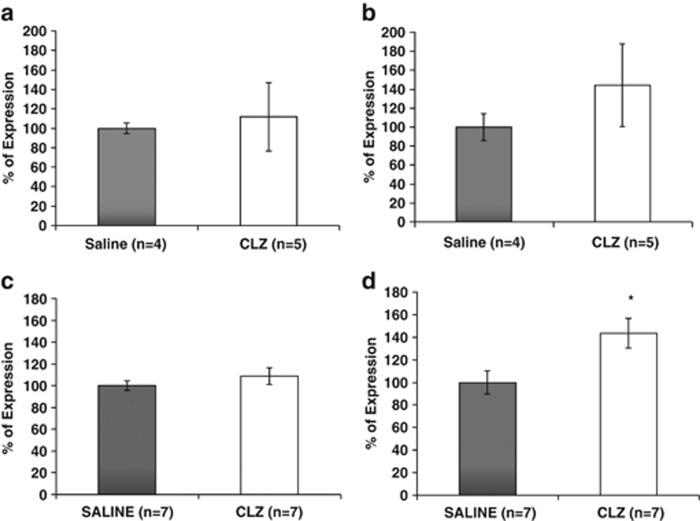
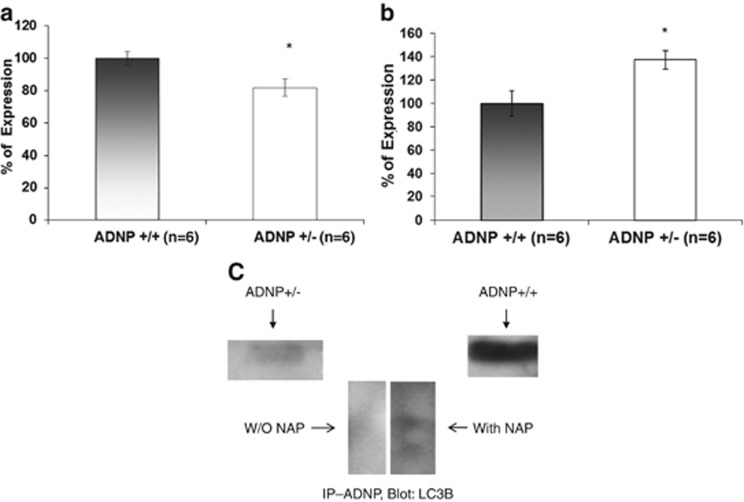
Autophagy is a process preserving the balance between synthesis, degradation and recycling of cellular components and is therefore essential for neuronal survival and function. Several key proteins govern the autophagy pathway including beclin1 and microtubule associated protein 1 light chain 3 (LC3). Here, we show a brain-specific reduction in beclin1 expression in postmortem hippocampus of schizophrenia patients, not detected in peripheral lymphocytes. This is in contrast with activity-dependent neuroprotective protein (ADNP) and ADNP2, which we have previously found to be deregulated in postmortem hippocampal samples from schizophrenia patients, but that now showed a significantly increased expression in lymphocytes from related patients, similar to increases in the anti-apoptotic, beclin1-interacting, Bcl2. The increase in ADNP was associated with the initial stages of the disease, possibly reflecting a compensatory effect. The increase in ADNP2 might be a consequence of neuroleptic treatment, as seen in rats subjected to clozapine treatment. ADNP haploinsufficiency in mice, which results in age-related neuronal death, cognitive and social dysfunction, exhibited reduced hippocampal beclin1 and increased Bcl2 expression (mimicking schizophrenia and normal human aging). At the protein level, ADNP co-immunoprecipitated with LC3B suggesting a direct association with the autophagy process and paving the path to novel targets for drug design.


Figures

Figure 1
Figure 1
Beclinl transcript expression in postmortem hippocampus and lymphocytes of schizophrenia patients compared to healthy controls. (a) Hippocampus (**P<0.01). (b) Lymphocytes (no significant change). Results (% of control) are depicted as means +/− s.e.m (c, d). Age-dependence of the expression in postmortem hippocampus. (c) Beclinl did not correlate with age, although a trend of decrease with age was seen in the control subjects (Pearson's correlation, r=−0.429, P=0.164). (d) Bcl2 was significantly increased with age in the control subjects (Pearson's correlation, r=0.639, P<0.05). In contrast, Bcl2 expression did not correlate with age in hippocampal samples from the schizophrenia post-mortem brains. Control (CON)-closed circles, heavy line; schizophrenia (SCZ), squares with hairy +, light line. Expression levels=2−Δ Ct times 100. (e, f) Lymphocyte Bcl2 expression. (e) Bcl2 mRNA levels were significantly increased in schizophrenia patients compared to healthy age-matched controls (*P<0.05). Results were calculated as means +/−s.e.m, and relative expression as % of control. (f) A trend toward increased Bcl2 mRNA levels with age was observed only in the healthy cohort, similar to the results in the hippocampal samples (d) Control (CON)-closed circles, heavy line; schizophrenia (SCZ), squares with hairy +, light line. Expression levels=2−Δ Ct times.
Figure 2
Figure 2
ADNP and ADNP2 transcript expression in human lymphocytes. (a) ADNP and (b) ADNP2 expression was significantly increased in schizophrenia patients compared to healthy controls (**P<0.001 and *P<0.05, respectively). Expression levels were calculated as % of control.
Figure 3
Figure 3
Effect of disease duration and sex on human lymphocyte ADNP and ADNP2 expression. (a) ADNP relative expression correlated negatively with disease duration (r=−0.581, P=0.037). (b) ADNP2 relative expression did not correlate with disease duration. (c) Female ADNP expression showed a significant negative correlation with disease duration (r=−0.76, P=0.049). (d) Male ADNP expression did not correlate with disease duration. Expression levels were calculated as % of control.
Figure 4
Figure 4
ADNP and ADNP2 expression in Sprague–Dawley rat lymphocytes and spleens following clozapine (CLZ) treatment (25 g per liter drinking water; 21 days). (a) ADNP transcript expression levels did not significantly change in lymphocytes of CLZ treated rats. (b) As in ADNP, no changes were detected in ADNP2 relative expression levels in lymphocytes of rats treated with CLZ. (c) ADNP expression values did not show any changes in spleens of rats treated with CLZ. (d) In contrast to ADNP, ADNP2 expression was significantly increased in spleens from CLZ-treated rats (*P<0.05).
Figure 5
Figure 5
Autophagy/apoptosis cascade markers in ADNP+/− mice. (a) Beclinl expression was significantly decreased in the hippocampus of the ADNP+/− mouse (*P<0.05). (b) Bcl2 mRNA expression was significantly increased in the hippocampus of the ADNP+/− mouse (*P<0.05). BAX levels did not significantly change (106% in ADNP+/− vs 100% in ADNP+/+, P=0.79, data not shown). 6.5-month-old male littermate ADNP+/− and ADNP+/+ mice were used. (c) Immunoprecipitation (IP) of ADNP revealed direct interaction with LC3B by western analysis. The ADNP–LC3B interaction correlated with the level of ADNP expression, a strong interaction in normal mice (ADNP+/+, right band) and a weaker interaction in ADNP+/− mice (left band). The interaction of ADNP with LC3B was augmented in the presence of NAP and two bands are seen in the SH-SY5Y neuronal model cells (middle panel).

References

    1. Kuma A, Hatano M, Matsui M, Yamamoto A, Nakaya H, Yoshimori T, et al. The role of autophagy during the early neonatal starvation period. Nature. 2004;432:1032–1036. - PubMed
    1. Hara T, Nakamura K, Matsui M, Yamamoto A, Nakahara Y, Suzuki-Migishima R, et al. Suppression of basal autophagy in neural cells causes neurodegenerative disease in mice. Nature. 2006;441:885–889. - PubMed
    1. Mortensen M, Ferguson DJ, Edelmann M, Kessler B, Morten KJ, Komatsu M, et al. Loss of autophagy in erythroid cells leads to defective removal of mitochondria and severe anemia in vivo. Proc Natl Acad Sci USA. 2010;107:832–837. - PMC - PubMed
    1. Debnath J, Baehrecke EH, Kroemer G. Does autophagy contribute to cell death. Autophagy. 2005;1:66–74. - PubMed
    1. Lum JJ, Bauer DE, Kong M, Harris MH, Li C, Lindsten T, et al. Growth factor regulation of autophagy and cell survival in the absence of apoptosis. Cell. 2005;120:237–248. - PubMed

Publication types

MeSH terms