. 2014 Jan;21(Pt 1):66-75.
doi: 10.1107/S1600577513029676. Epub 2013 Dec 12.

The Bionanoprobe: hard X-ray fluorescence nanoprobe with cryogenic capabilities

Affiliations

The Bionanoprobe: hard X-ray fluorescence nanoprobe with cryogenic capabilities

S Chen et al. J Synchrotron Radiat. 2014 Jan.

Abstract

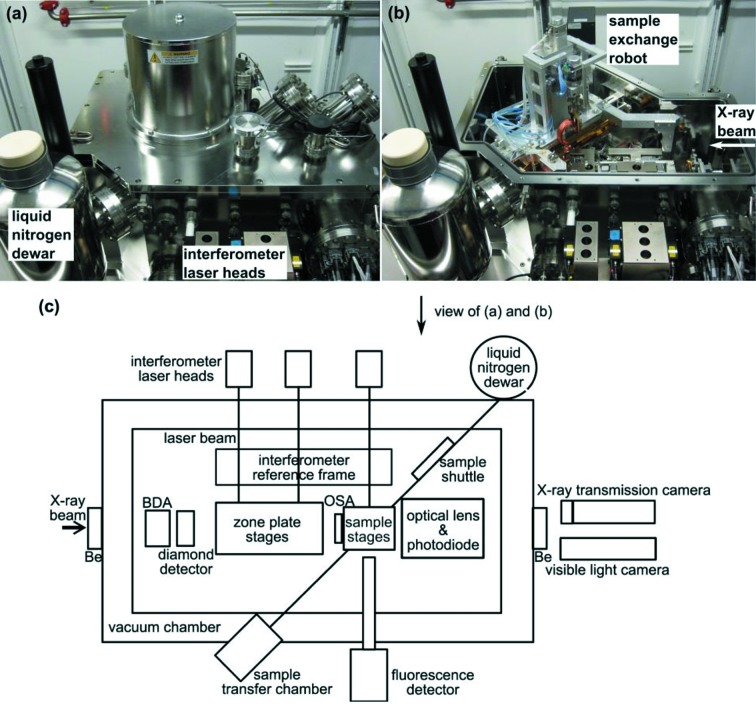
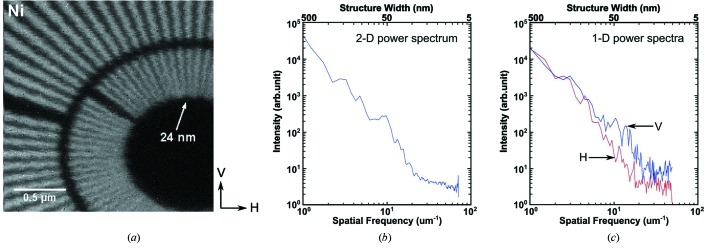
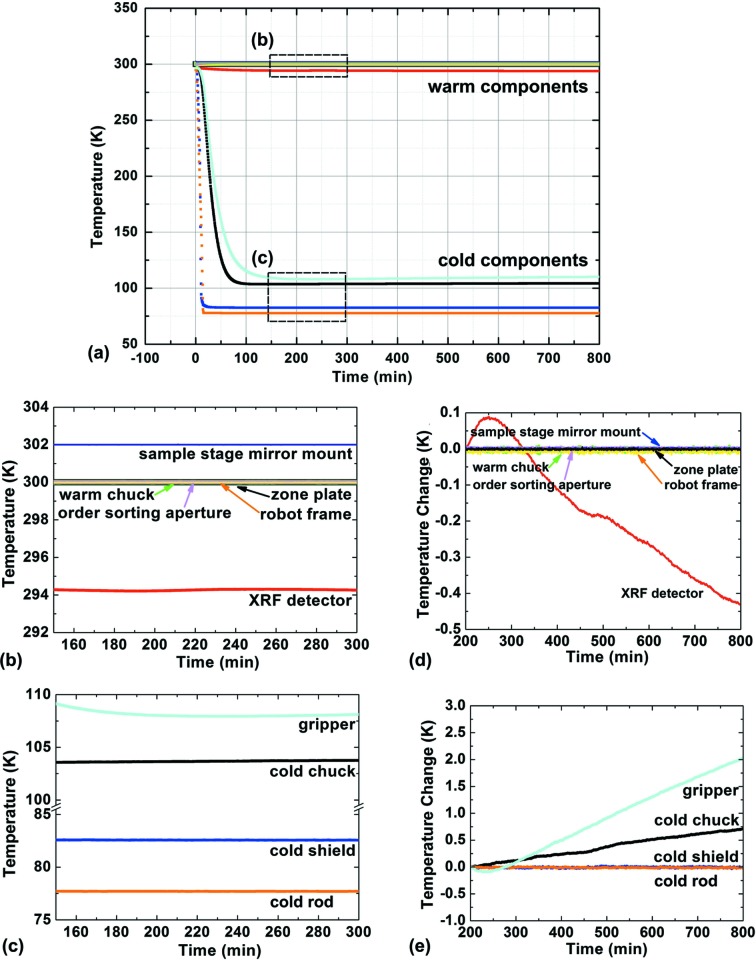
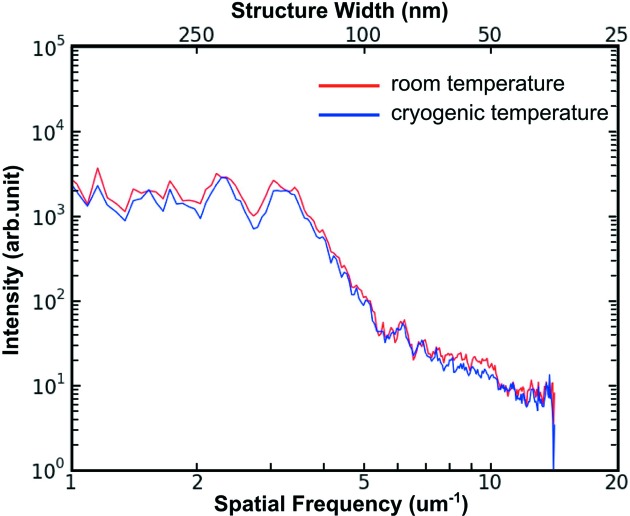
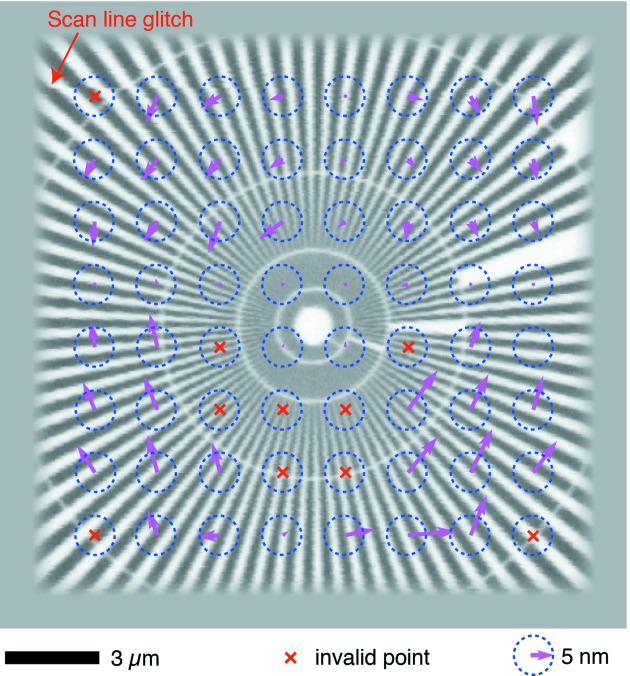
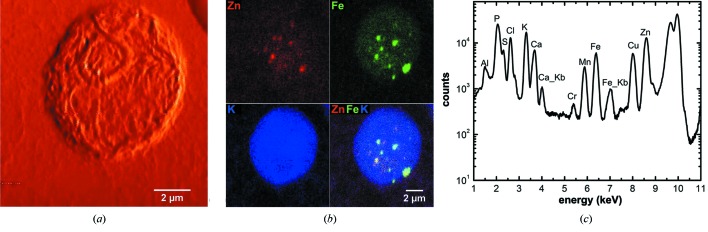
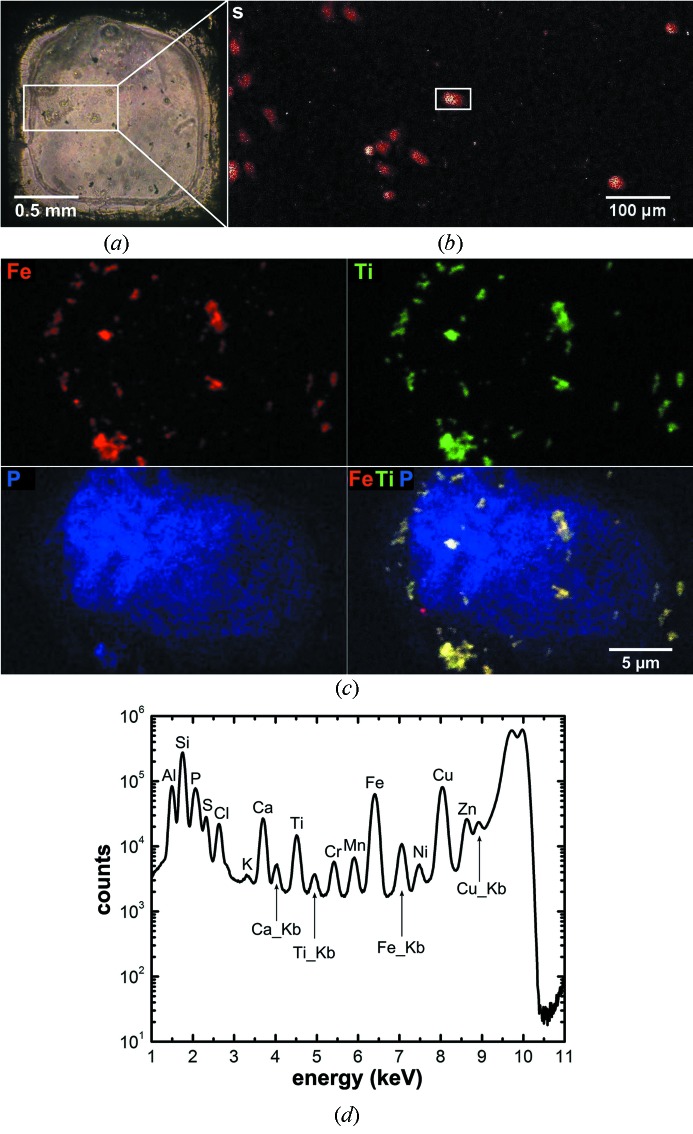
Hard X-ray fluorescence microscopy is one of the most sensitive techniques for performing trace elemental analysis of biological samples such as whole cells and tissues. Conventional sample preparation methods usually involve dehydration, which removes cellular water and may consequently cause structural collapse, or invasive processes such as embedding. Radiation-induced artifacts may also become an issue, particularly as the spatial resolution increases beyond the sub-micrometer scale. To allow imaging under hydrated conditions, close to the `natural state', as well as to reduce structural radiation damage, the Bionanoprobe (BNP) has been developed, a hard X-ray fluorescence nanoprobe with cryogenic sample environment and cryo transfer capabilities, dedicated to studying trace elements in frozen-hydrated biological systems. The BNP is installed at an undulator beamline at sector 21 of the Advanced Photon Source. It provides a spatial resolution of 30 nm for two-dimensional fluorescence imaging. In this first demonstration the instrument design and motion control principles are described, the instrument performance is quantified, and the first results obtained with the BNP on frozen-hydrated whole cells are reported.

Keywords: Bionanoprobe; cryogenic capabilities; hard X-ray fluorescence microscopy.


Figures

Figure 1
Figure 1
Photographs (a, b) and schematic (c) of the BNP. The BNP is a sample-scanning hard X-ray fluorescence nanoprobe with laser interferometer systems for accurate positioning and cryogenic capabilities dedicated to examination of frozen-hydrated biological samples. The monochromatic X-rays travel in and out of the vacuum chamber through beryllium windows. Fresnel zone plates are used as nanofocusing optics. While the sample is being scanned through the focused beam, fluorescence signals are collected using the detector mounted at 90° with regards to the incident X-ray beam. Downstream of the sample a quadrant photodiode is used to collect transmission signals for differential phase and absorption contrast imaging. The photodiode can also be moved out of the X-ray path to allow the use of either an X-ray transmission camera or a visible-light microscope outside the chamber for alignment. Liquid nitrogen is the primary cooling source. The sample stage, shuttle and robot gripper are conductively cooled by liquid nitrogen during operation.
Figure 2
Figure 2
Schematic showing the optical layout of the beamline and the BNP (not to scale). S h and S v are the horizontal and vertical source sizes, respectively, while d zp is the zone plate diameter. L a is the distance from the source to the horizontal white-beam slits (with a width d h, which serve as a secondary X-ray source in the horizontal direction). L is the distance from the source to the zone plate. Adequate spatial coherence for nanofocusing is provided when the full source size multiplied by the full acceptance angle phase space area is no larger than the X-ray wavelength λ, or d h d zp/(LL a) < λ in the horizontal and S v d zp/L < λ in the vertical direction. This condition is met by the APS source size in the vertical direction and can be reached in the horizontal direction by adjusting the width of the white-beam slits d h.
Figure 3
Figure 3
The sample exchange robot, shuttle and sample cartridges are shown on the left, while an example sample cartridge is shown on the right. Frozen biological samples are transferred under cryogenic conditions from an offline workstation into the BNP vacuum chamber. The robotic sample-exchange mechanism is designed to change samples in the BNP chamber while maintaining all the samples at a temperature below 110 K.
Figure 4
Figure 4
Images of a nickel (Ni) Siemens star test pattern to determine spatial resolution. (a) Ni fluorescence mapping of a 2 µm × 2 µm region acquired using fly-scan mode (continuous motion in the horizontal direction) with 10 nm pixel size and 30 ms dwell time per pixel. (b) Two-dimensional azimuthal power spectrum of the image indicating a cut-off spatial frequency of 20 µm−1, corresponding to a 25 nm half-period structure width. (c) One-dimensional power spectra of the image (horizontal direction in red, vertical direction in blue), indicating slightly better spatial resolution in the vertical direction.
Figure 5
Figure 5
Graphs showing the temperatures of both cold and warm components recorded for ∼13 h starting with cooling of the BNP. The zoomed-in regions (b) and (c) show that both the warm and cold components achieved reasonably stable status after ∼2.5 h, with temperature changes between 200–800 min shown in (d) and (e). These measurements assure that the specimen can be kept below 110 K during cartridge changes, and for longer-term storage inside the vacuum chamber of the instrument. Temperature stability is also required to minimize specimen drift due to thermal expansion.
Figure 6
Figure 6
Two-dimensional azimuthal power spectra of two fluorescence images of the central spokes of a Ni test pattern that were obtained using identical scanning parameters (ZP70-160, 50 nm step size and 50 ms dwell time per pixel) at different thermal conditions (room temperature in red, cryogenic conditions in blue). This indicates that the BNP is able to deliver images with the same spatial resolution under both thermal conditions.
Figure 7
Figure 7
Image field distortion map of a test pattern imaged at cryogenic temperatures showing sub-15 nm field distortion. A Ni test pattern was imaged twice using the Ni fluorescence signal (both images had 50 nm step size and 50 ms per-pixel dwell time). The two images were then aligned by cross correlation from the center of the image, yielding an overall shift of the scan field of 2.8 pixels or 140 nm. After shifting the second image to correct for that overall shift, the image was broken up into 8 × 8 subfields. Sub-pixel-resolution cross correlation was used to measure the shift of subfields between the two images. The resulting magnitude and direction of the shift was plotted as an arrow with scaled length (scaled to 5 nm shift radius represented by the blue dashed circle). About 85% of these subfield shifts are less than 15 nm. This test shows that there is small relative distortion between images, allowing for consistent registration of images in applications such as spectromicroscopy and tomography.
Figure 8
Figure 8
Images of a frozen-hydrated algae cell (Chlamydomonas reinhardtii) obtained using the BNP. (a) Differential phase contrast image showing some cell ultrastructure. (b) X-ray fluorescence images showing the distributions and the overlay of zinc (Zn), iron (Fe) and potassium (K). The count levels (minimum to maximum range in counts s−1) are 0–714 for Zn, 0–378 for Fe and 0–899 for K. The algae sample was plunge frozen in liquid ethane and stored in liquid nitrogen for several weeks before examination by the BNP. The images were acquired using fly-scan mode (continuous motion in the horizontal direction) with 35 nm step size and 250 ms dwell time per pixel. One of diffusible ions, K, shows a slightly uneven distribution in the cell demonstrating good cryogenic sample preparation and handling. The fluorescence maps were created by performing peak area fitting for every pixel. (c) The summed spectrum of the whole map with major peaks labeled. While the Kα lines are labeled with element symbols only, the Kβ lines are indicated using ‘Kb’ in the graph.
Figure 9
Figure 9
Images of a frozen-hydrated and chemically fixed HeLa cell sample that was treated with Fe3O4@TiO2 nanocomposites for 30 min. The nanocomposites consist of Fe3O4@TiO2 nanoparticles and peptides. The size of the Fe3O4@TiO2 nanoparticles is 6–7 nm, measured using atomic force microscopy. The peptides are 11 amino acids long with an N-terminal 3,4-dihydroxyphenyacetic acid moiety. (a) Overview optical image of the frozen-hydrated sample obtained using a Nikon light microscope equipped with an Instec cold stage. A 750 µm × 350 µm area of this sample, indicated by the white rectangle in (a), was rapidly scanned by the BNP to gain an overview of the distribution of cells in this sample. (b) Sulfur (S) fluorescence map of the sample area indicated in (a), acquired using fly-scan mode (continuous motion in the horizontal direction) with 0.85 µm step size. The count level (minimum to maximum range in counts s−1) is 0–100. The S signal indicates the presence of the cells. A 30 µm × 18 µm area, indicated by the white rectangle in (b), encompasses a single cell. (c) High-resolution fluorescence maps of the cell selected in (b) showing the distributions of iron (Fe), titanium (Ti), phosphorus (P) and their overlay. This image was acquired using fly-scan mode (continuous motion in the horizontal direction) with a 50 nm step size and 100 ms dwell time per pixel. The count levels (minimum to maximum range in counts s−1) are 0–705 for Fe, 0–569 for Ti and 0–124 for P. While P shows a cell outline, and a more intense P concentration in the region of the cell nucleus, co-localized Ti and Fe pixels correspond to the distribution of nanocomposites. The fluorescence maps were created by performing peak area fitting for every pixel. (d) The summed spectrum of the whole map with major peaks labeled. While the Kα lines are labeled with element symbols only, the Kβ lines are indicated using ‘Kb’ in the graph.

References

    1. Arora, H. C., Jensen, M. P., Yuan, Y., Wu, A., Vogt, S., Paunesku, T. & Woloschak, G. (2012). Cancer Res. 72, 769–778. - PMC - PubMed
    1. Beetz, T. & Jacobsen, C. (2003). J. Synchrotron Rad. 10, 280–283. - PubMed
    1. Beveridge, T. J. (2005). J. Nucl. Radiochem. Sci. 6, 7–10.
    1. Bleuet, P., Cloetens, P., Gergaud, P., Mariolle, D., Chevalier, N., Tucoulou, R., Susini, J. & Chabli, A. (2009). Rev. Sci. Instrum. 80, 1–3. - PubMed
    1. Bohic, S., Cotte, M., Salomé, M., Fayard, B., Kuehbacher, M., Cloetens, P., Martinez-Criado, G., Tucoulou, R. & Susini, J. (2012). J. Struct. Biol. 177, 248–258. - PubMed

Publication types

Substances