Comparative Study
. 2014 Mar;63(3):490-9.
doi: 10.1161/HYPERTENSIONAHA.113.02219. Epub 2013 Dec 23.

Macrophage migration inhibitory factor deletion exacerbates pressure overload-induced cardiac hypertrophy through mitigating autophagy

Affiliations
Comparative Study

Macrophage migration inhibitory factor deletion exacerbates pressure overload-induced cardiac hypertrophy through mitigating autophagy

Xihui Xu et al. Hypertension. 2014 Mar.

Abstract

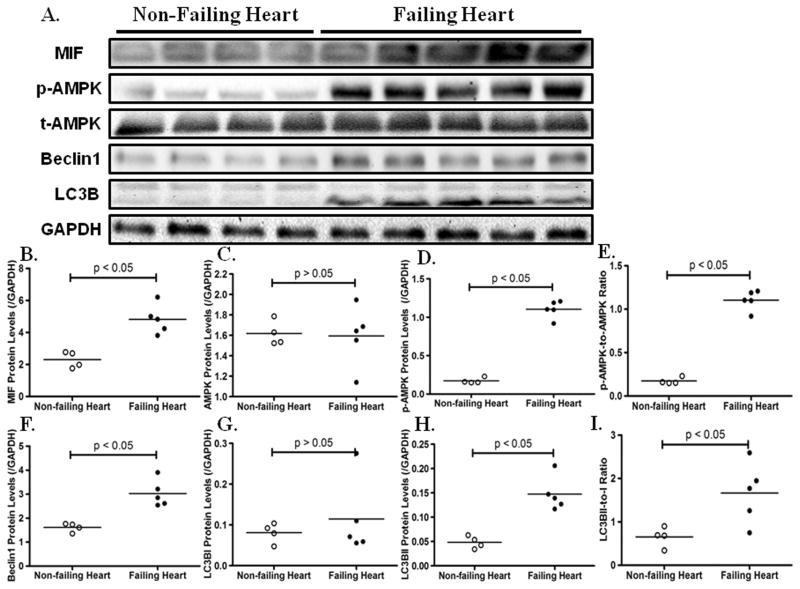
The proinflammatory cytokine macrophage migration inhibitory factor (MIF) has been shown to be cardioprotective under various pathological conditions. However, the underlying mechanisms still remain elusive. In this study, we revealed that MIF deficiency overtly exacerbated abdominal aorta constriction-induced cardiac hypertrophy and contractile anomalies. MIF deficiency interrupted myocardial autophagy in hypertrophied hearts. Rapamycin administration mitigated the exacerbated hypertrophic responses in MIF(-/-) mice. Using the phenylephrine-induced hypertrophy in vitro model in H9C2 myoblasts, we confirmed that MIF governed the activation of AMP-activated protein kinase-mammalian target of rapamycin-autophagy cascade. Confocal microscopic examination demonstrated that MIF depletion prevented phenylephrine-induced mitophagy in H9C2 myoblasts. Myocardial Parkin, an E3 ubiquitin ligase and a marker for mitophagy, was significantly upregulated after sustained pressure overload, the effect of which was prevented by MIF knockout. Furthermore, our data exhibited that levels of MIF, AMP-activated protein kinase activation, and autophagy were elevated concurrently in human failing hearts. These data indicate that endogenous MIF regulates the mammalian target of rapamycin signaling to activate autophagy to preserve cardiac geometry and protect against hypertrophic responses.

Keywords: autophagy; cardiac hypertrophy; macrophage migration inhibitory factor; mammalian target of rapamycin; rapamycin.


Conflict of interest statement

CONFLICT OF INTERESTS

None.

Figures

Fig. 1
Fig. 1
(A): Kaplan-Meier survival curves of WT and MIF−/− mice following AAC surgery; (B): Diastolic blood pressure; (C): Systolic blood pressure; and (D): Mean blood pressure in WT and MIF−/− mice 30 days after sham or AAC surgery; (E): Quantitative analysis of MIF expression; Inset: Representative western blots depicting expression of MIF and GAPDH (loading control); (F): Fractional shortening (%); (G): LV end diastolic diameter (LVEDD); (H): LV end systolic diameter (LVESD); (I): Cardiomyocyte peak shortening (PS, normalized to resting cell length); (J): Maximal velocity of shortening (+ dL/dt); (K): Maximal velocity of relengthening (− dL/dt); and (L): Time-to-90% relengthening (TR90) in isolated cardiomyocytes. Mean ± SEM, n = 10 mice (panel A–H), or 100–130 cells from 5 mice (panel I–L) per group, * p < 0.05 vs. WT Sham group, # p < 0.05 vs. WT AAC group.
Fig. 2
Fig. 2
Effect of MIF deficiency on pressure overload-induced changes in myocardial autophagy. (A): Representative gel blots depicting levels of total and phosphorylated AMPK and mTOR, as well as LC3BI/II, p62, Beclin1, Atg5, Atg7, Bip and GAPDH (as loading control) using specific antibodies; (B): AMPKα phosphorylation (Thr172, pAMPKα-to-AMPKα ratio); (C): Total AMPK; (D): mTOR phosphorylation (Ser2448, p-mTOR-to-mTOR ratio); (E): Total mTOR; (F): LC3BI; (G): LC3BII; (H): LC3BII-to-I ratio; (I): p62; (J): Beclin1; (K): Atg5; (L): Atg7; and (M): Bip. Mean ± SEM, n = 5–6 mice per group, * p < 0.05 vs. WT Sham group, # p < 0.05 vs. WT AAC group.
Fig. 3
Fig. 3
Echocardiographic and cardiomyocyte contractile properties in WT and MIF−/− mice with or without AAC surgery. A cohort of MIF−/− mice received the autophagy inducer rapamycin (2 mg/kg/d, i.p.) starting one week after sham or AAC surgery for 3 more weeks. (A): Fractional shortening (%); (B): LVEDD; (C): LVESD; (D): Resting cell length in cardiomyocytes; (E): Cardiomyocyte peak shortening (PS, normalized to resting cell length); (F): + dL/dt; (G): − dL/dt; (H): TPS; and (I): TR90. Mean ± SEM, n = 8–9 mice (panel A–C) or 100–130 cells from 5 mice (panel D–I) per group, * p < 0.05 vs. WT Sham group, # p < 0.05 vs. WT AAC group, †p < 0.05 vs. MIF−/− AAC group.
Fig. 4
Fig. 4
Effect of autophagy induction on phenylephrine (PE, 100 μM for 48 hrs)-induced hypertrophy in H9C2 myoblast cells. (A): H9C2 cells in normal DMEM medium; (B): H9C2 cells with MIF siRNA knockdown; (C): H9C2 cells challenged with PE; (D): H9C2 cells with MIF knockdown challenged with PE; (E): H9C2 cells challenged concurrently with PE and the autophagy inducer rapamycin (Rapa, 100 nM), Rapamycin was administered 10 min prior to the addition of PE; (F): H9C2 cells with MIF knockdown incubated concurrently with PE and rapamycin; (G): H9C2 cells incubated concurrently with PE, rapamycin and the autophagy inhibitor 3-MA (2.5 mM); (H): H9C2 cells with MIF knockdown incubated concurrently with PE, rapamycin and 3-MA; (I): Quantitative analysis of H9C2 cell surface area using measurement from ~ 50 cells per group; and (J): Quantitative analysis of [3H]-Leucine incorporation in H9C2 myoblasts. Mean ± SEM, n = 50 cells per group, * p < 0.05 vs. control group, # p < 0.05 vs. PE group, † p < 0.05 vs. MIF siRNA PE group.
Fig. 5
Fig. 5
Effect of AMPK activation (AICAR, 1 mM for 24 hrs) and autophagy inhibition (3-MA, 2.5 mM) on PE (100 μM)-induced hypertrophic response in MIF-intact and MIF-silenced H9C2 myoblast cells. (A): H9C2 cells incubated in normal DMEM medium; (B): H9C2 cells with MIF siRNA knockdown; (C): H9C2 cells challenged with PE; (D): H9C2 cells with MIF knockdown challenged with PE; (E): H9C2 cells incubated concurrently with PE and AICAR; (F): H9C2 cells with MIF knockdown incubated concurrently with PE and AICAR; (G): H9C2 cells incubated concurrently with PE, AICAR and 3-MA; (H): H9C2 cells with MIF knockdown incubated with PE, AICAR and 3-MA; (I): Quantitative analysis of H9C2 cell surface area using measurement from ~ 50 cells per group; and (J): Quantitative analysis of [3H]-Leucine incorporation in H9C2 cells. Mean ± SEM, n = 50 cells each group, * p < 0.05 vs. control group, # p < 0.05 vs. PE group, † p < 0.05 vs. MIF siRNA PE group.
Fig. 6
Fig. 6
MIF knockdown or depletion interrupts mitophagy activation in H9C2 cells challenged with phenylephrine (PE, 100 μM for 48 hrs) and murine hearts subjected to pressure overload. Confocal microscopic images depicted that MIF knockdown prevented PE-induced mitophagy in H9C2 cells (A–P). H9C2 cells were transfected with GFP-LC3B (green). Mitochondria were detected using a mitochondria-staining kit (red), and lysosomes were detected using a lysosome-staining kit (blue). Data were from 3 independent experiments. Arrows denote mitophagy, which is shown as the colocalization of LC3B, mitochondria and lysosomes. (Q): Representative gel blots depicting levels of Parkin in hearts from WT and MIF−/− mice in the absence or presence of pressure overload. GAPDH was used as the loading control; and (R): Parkin expression. Mean ± SEM, n = 5–6 mice per group, * p < 0.05 vs. WT Sham group, # p < 0.05 vs. WT AAC group.
Fig. 7
Fig. 7
Myocardial expression of MIF, AMPK and autophagy markers in non-failing and failing human hearts. (A): Representative gel blots depicting levels of MIF, total and phosphorylated AMPK, Beclin1, LC3BI/II and GAPDH (loading control) using specific antibodies; (B): MIF; (C): Total AMPK; (D): Phosphorylated AMPKα (Thr172); (E): AMPKα phosphorylation shown as pAMPKα-to-AMPKα ratio; (F): Beclin1; (G): LC3BI; (H): LC3BII; and (I): LC3BII-to-I ratio; n = 4 and 5 for non-failing and failing hearts, respectively.

References

    1. Maron BJ, Shirani J, Poliac LC, Mathenge R, Roberts WC, Mueller FO. Sudden death in young competitive athletes. Clinical, demographic, and pathological profiles. JAMA. 1996;276:199–204. - PubMed
    1. Elliott P, McKenna WJ. Hypertrophic cardiomyopathy. Lancet. 2004;363:1881–1891. - PubMed
    1. Hua Y, Zhang Y, Ren J. Igf-1 deficiency resists cardiac hypertrophy and myocardial contractile dysfunction: Role of microrna-1 and microrna-133a. J Cell Mol Med. 2012;16:83–95. - PMC - PubMed
    1. Brown JH, Del Re DP, Sussman MA. The rac and rho hall of fame: A decade of hypertrophic signaling hits. Circ Res. 2006;98:730–742. - PubMed
    1. Antos CL, McKinsey TA, Frey N, Kutschke W, McAnally J, Shelton JM, Richardson JA, Hill JA, Olson EN. Activated glycogen synthase-3 beta suppresses cardiac hypertrophy in vivo. Proc Natl Acad Sci U S A. 2002;99:907–912. - PMC - PubMed

Publication types

Substances