Review
. 2013 Dec 23;369(1635):20120511.
doi: 10.1098/rstb.2012.0511. Print 2014 Feb 5.

Network mechanisms of grid cells

Affiliations
Review

Network mechanisms of grid cells

Edvard I Moser et al. Philos Trans R Soc Lond B Biol Sci. .

Abstract

One of the major breakthroughs in neuroscience is the emerging understanding of how signals from the external environment are extracted and represented in the primary sensory cortices of the mammalian brain. The operational principles of the rest of the cortex, however, have essentially remained in the dark. The discovery of grid cells, and their functional organization, opens the door to some of the first insights into the workings of the association cortices, at a stage of neural processing where firing properties are shaped not primarily by the nature of incoming sensory signals but rather by internal self-organizing principles. Grid cells are place-modulated neurons whose firing locations define a periodic triangular array overlaid on the entire space available to a moving animal. The unclouded firing pattern of these cells is rare within the association cortices. In this paper, we shall review recent advances in our understanding of the mechanisms of grid-cell formation which suggest that the pattern originates by competitive network interactions, and we shall relate these ideas to new insights regarding the organization of grid cells into functionally segregated modules.

Keywords: attractor network; cortex; entorhinal cortex; grid cells; hippocampus; spatial representation.


Figures

Figure 1.
Figure 1.
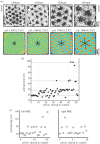
Inhibition-based attractor network model for grid cells. (a) A hexagonal grid pattern forms spontaneously (here over a period of 500 ms) on a two-dimensional neuronal lattice consisting of stellate cells that have all-or-none inhibitory connections with each other. Neurons are arranged on the lattice according to their spatial phases. Activity is colour-coded, as indicated by the scale bar at the bottom. Connection radii R of two example neurons are shown as white and green circles (diameter 2R). Note lower activity where the circles overlap (at 500 ms). (b) Simulated single neuron activity (red dots) over 10 min of foraging in a 1.8 m diameter circular arena. W0 is the strength of the inhibitory connectivity of the network; R is the radius. Note that W0 and R control the size of the grid fields and their spacing. (c) Effect of excitatory drive from the hippocampus. Spike distribution plots (as in b) and directional tuning curves (firing rate as a function of direction) for two example cells in the presence of strong hippocampal output (top) and weak hippocampal output (bottom). (d) Grid scores (sixfold rotational symmetry) and mean vector length (directional tuning) as a function of the strength of external input (means ± s.e.m.). With large hippocampal inputs, high grid scores are obtained, as in the top image in (c). When the external input is decreased below a critical amount, as in the bottom image of (c), the activity on the neuronal sheet gets easily distorted and hexagonal structure is not detectable over time. At the same time, the head-directional input becomes the dominant source of input and the neurons show high directional tuning. (a,b) Adapted from [32]; (c,d) from [33].
Figure 2.
Figure 2.
Modular organization of the grid map. (a) Examples of grid cells belonging to modules with different grid spacing. Left to right: Spike maps (top row) and colour-coded autocorrelation maps (bottom row) for four example cells. Trajectory of the rat is shown in grey, with all of the cell's spike locations superimposed in black. Colour scale for the autocorrelation maps is from blue (r =−1) to red (r = 1). Recording depth along the dorsoventral axis of MEC is indicated at the top. (b) Step-like organization of grid scale. Grid spacing is shown as a function of position along the recording track in MEC, with cells (dots) rank-ordered from dorsal to ventral. Note that grid spacing clusters into four different values in this recording. Horizontal lines indicate mean values for k-means-identified clusters. (c) Step-like changes in grid spacing in grid cells recorded simultaneously in left and right MEC. Cells are numbered according to position along the dorsoventral MEC axis. Note discrete nature of the distributions as well as identical values for grid spacing in the two locations. (Adapted from [46].)

References

    1. Hafting T, Fyhn M, Molden S, Moser M-B, Moser EI. 2005. Microstructure of a spatial map in the entorhinal cortex. Nature 436, 801–806. (10.1038/nature03721) - DOI - PubMed
    1. Moser EI, Kropff E, Moser M-B. 2008. Place cells, grid cells, and the brain's spatial representation system. Annu. Rev. Neurosci. 31, 69–89. (10.1146/annurev.neuro.31.061307.090723) - DOI - PubMed
    1. Giocomo LM, Moser MB, Moser EI. 2011. Computational models of grid cells. Neuron 71, 589–603. (10.1016/j.neuron.2011.07.023) - DOI - PubMed
    1. Sargolini F, Fyhn M, Hafting T, McNaughton BL, Witter MP, Moser M-B, Moser EI. 2006. Conjunctive representation of position, direction and velocity in entorhinal cortex. Science 312, 754–758. (10.1126/science.1125572) - DOI - PubMed
    1. Boccara CN, Sargolini F, Thoresen VH, Solstad T, Witter MP, Moser EI, Moser M-B. 2010. Grid cells in pre- and parasubiculum. Nat. Neurosci. 13, 987–994. (10.1038/nn.2602) - DOI - PubMed

Publication types

LinkOut - more resources