. 2013 Dec 23;369(1635):20120523.
doi: 10.1098/rstb.2012.0523. Print 2014 Feb 5.

Neuronal rebound spiking, resonance frequency and theta cycle skipping may contribute to grid cell firing in medial entorhinal cortex

Affiliations

Neuronal rebound spiking, resonance frequency and theta cycle skipping may contribute to grid cell firing in medial entorhinal cortex

Michael E Hasselmo. Philos Trans R Soc Lond B Biol Sci. .

Abstract

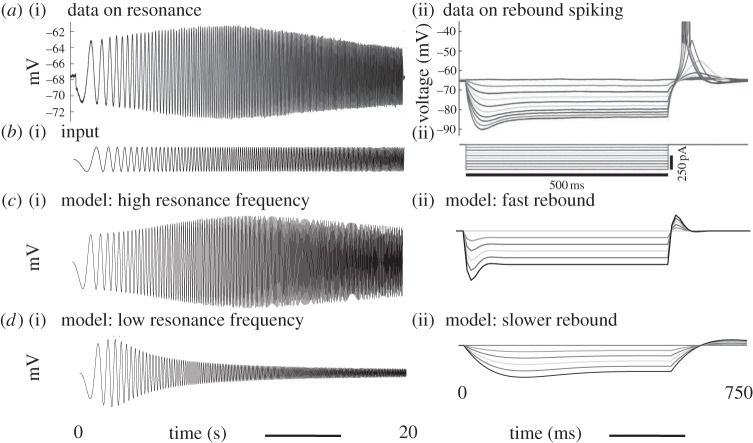
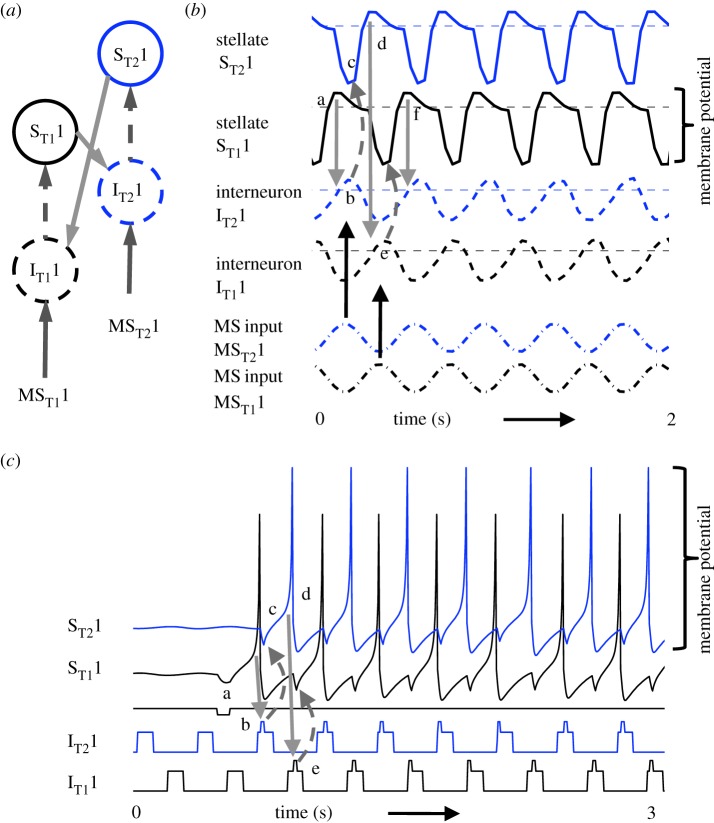
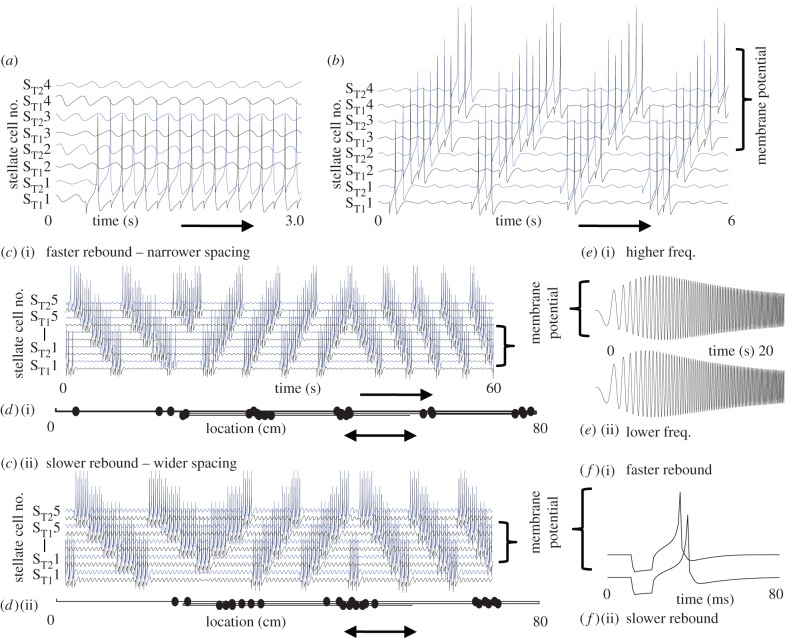
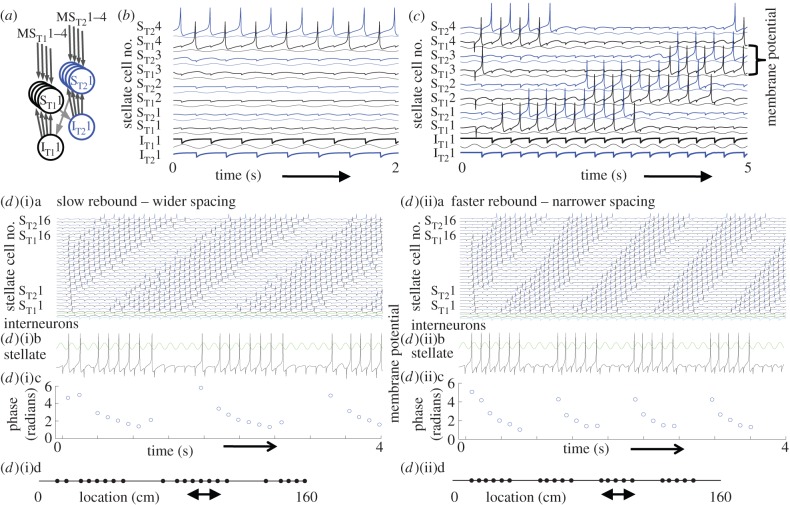
Data show a relationship of cellular resonance and network oscillations in the entorhinal cortex to the spatial periodicity of grid cells. This paper presents a model that simulates the resonance and rebound spiking properties of entorhinal neurons to generate spatial periodicity dependent upon phasic input from medial septum. The model shows that a difference in spatial periodicity can result from a difference in neuronal resonance frequency that replicates data from several experiments. The model also demonstrates a functional role for the phenomenon of theta cycle skipping in the medial entorhinal cortex.

Keywords: entorhinal cortex; grid cells; head direction; place cells; rat; theta rhythm.


Figures

Figure 1.
Figure 1.
(a(i)) Experimental data showing the membrane potential of a layer II medial entorhinal cortex stellate cell during resonance testing (data in (a(i)(ii)) gathered by Shay [37]). In response to oscillating current injection that increases in frequency, the neuron shows a gradual increase in amplitude of membrane potential deflection that reaches a peak at resonance frequency, and then decreases. (b(i)) The chirp function input to (a(i)) sweeps from 0 to 20 Hz over a period of 20 s. (c(i)) A simulated stellate cell using equation (4.1) shows the same theta frequency resonance in response to the chirp function, with gp = 0.75, gh = 0.15 and oh = 0.35. (d(i)) A simulated cell with a different parameter gp = 0.109, gh = 0.009 and oh = 0.1 shows resonance at lower frequency (1–2 Hz) similar to bats or mice with knockout of the HCN1 subunit. (a(ii)) Experimental data show the membrane potential of a layer II stellate cell during and after hyperpolarizing steps of different amplitude, showing the depolarizing sag during input, and the depolarizing rebound that generates spikes after input [37]. (b(ii)) Input to (a(ii)) showing hyperpolarizing steps. (c(ii)) A simulated stellate cell using the parameters in (c(i)) shows the same depolarizing sag during simulated current injection and depolarizing rebound afterward. (d(ii)) A simulated cell with parameters from (d(i)) still shows sag and rebound but on a slower time-scale.
Figure 2.
Figure 2.
Sustained circuit activity with inhibitory feedback. (a) Local circuit showing excitatory connections (solid arrows) from stellate cell with index ST11 to interneuron with index ST11, and from stellate cell ST21 to interneuron IT21, and inhibitory connections (dashed arrows) from interneuron IT11 to stellate cell ST11 and from interneuron IT21 to stellate cell ST21. (b) Time course of change in activation of one coupled pair of cells: (step a) stellate cell ST11 (solid black line) starts out hyperpolarized, rebounds over the threshold shown by dotted line and sends excitatory synaptic output (grey line) to interneuron IT21; (step b) interneuron IT21 (dashed black line) is depolarized over threshold (thin dashed line); (step c) interneuron IT21 sends inhibitory output (grey dashed arrow) to cause hyperpolarization in stellate cell ST21 (top line); (step d) stellate cell ST21 rebounds from the hyperpolarization to cross threshold (thin dashed line), sending excitatory output to interneuron IT11; (step e) this brings interneuron IT11 over threshold, sending inhibitory output (grey dashed arrow) to hyperpolarize stellate cell ST11; (step f) this causes stellate ST11 to show rebound spiking to start the same cycle again. Bottom traces show that throughout this simulation, the interneurons IT11 and IT21 receive oscillatory medial septal (MS) input that determines when these interneurons are close to threshold and can generate spikes in response to stellate input. This example uses parameters as in figure 1c(i). (c) Example of spiking model with resonance using Izhikevich neurons. A hyperpolarizing pulse (label a) given to stellate cell ST11 causes a rebound spike. This brings interneuron IT21 above threshold by label b. The interneuron IT21 inhibits stellate cell ST21 (label c), causing a rebound spike (label d) that activates interneuron IT11 (label e). This causes an inhibitory potential in stellate cell ST11 to start the cycle again. Spikes fall on alternating cycles. (Online version in colour.)
Figure 3.
Figure 3.
(a) Theta cycle skipping can remain stationary in stellate cells ST11 and ST21when rebound spiking matches the frequency of medial septal input to the interneurons (or when the interneurons get constant input). (b) Alternatively, the rebound spiking activity can shift between different stellate cells when the rebound spiking is faster than the period of oscillatory medial septal input to the interneurons. The shift is proportionate to the difference in frequency of resonance (rebound speed) and the frequency of medial septal input. (c) The rebound spiking can shift back and forth in a one-dimensional line of stellate cells when directional heading shifts from west (start) to east and back again with a corresponding shift in active interneurons with different phase distributions. The shift accelerates over time owing to a progressive increase in running speed. (c(i)) The shift is faster for cells with higher resonance frequency (e(i)) and faster rebound spiking (f(i)). The shift is slower for cells with lower resonance frequency (e(ii)) and slower rebound spiking (f(ii)). (d) The activity in (c) is plotted to show location of the rat (black dots) at the time of each spike generated by stellate cell ST14 (seventh line from bottom in figure 3c), showing firing in regular spatial locations as the rat runs back and forth along a linear track at different speeds (going different distances). (d(i)) Firing fields are closer together for cells with higher resonance frequency (e(i)) and faster rebound spiking (f(i)). (d(ii)) Firing fields are further apart for cells with lower resonance frequency (e(ii)) and slower rebound spiking (f(ii)). (Online version in colour.)
Figure 4.
Figure 4.
(a) Circuit design using oscillating medial septal (MS) input with different phases to two populations of stellate cells. Stellate cells interact with a single pair of interneurons that send inhibition to all stellate cells and cause rebound spiking in a subset of stellate cells. (b) Theta cycle skipping remains stationary in a subset of stellate cells ST14 and ST24 when rebound spiking matches the frequency of MS input to the stellate cells. For each cell, thick line shows membrane potential and thin line underneath shows MS input. Interneurons show strong feedback inhibition after each output spike. (c) Rebound spiking activity shifts between different stellate cells when rebound spiking is faster than the period of oscillatory MS input to the stellate cells. (d(i)a) In a larger population, the rebound spiking occurs in a subset of stellate cells and shifts progressively across the population. The spikes of an individual stellate cell (d(i)b) show theta phase precession relative to the medial septal frequency input (d(i)c). The spacing of firing fields is broad (d(i)d) when slow rebound spiking is only slightly faster than the medial septal input period. (d(ii)a) With faster rebound spiking, the difference from the period of medial septal input oscillations is larger. The spiking of individual cells (d(ii)b) shows faster theta phase precession (d(ii)c) and the size and spacing of firing fields are smaller (d(ii)d). (Online version in colour.)

Similar articles

Cited by

References

    1. Moser EI, Moser MB. 2008. A metric for space. Hippocampus 18, 1142–1156. (10.1002/hipo.20483) - DOI - PubMed
    1. Fyhn M, Molden S, Witter MP, Moser EI, Moser MB. 2004. Spatial representation in the entorhinal cortex. Science 305, 1258–1264. (10.1126/science.1099901) - DOI - PubMed
    1. Burgess N, Barry C, Jeffery KJ, O'Keefe J. 2005. A grid and place cell model of path integration utilizing phase precession versus theta. Poster presented at the Computational Cognitive Neuroscience Conference, Washington DC, 10–11 November 2005. See http://cdn.f1000.com/posters/docs/225.
    1. Burgess N, Barry C, O'Keefe J. 2007. An oscillatory interference model of grid cell firing. Hippocampus 17, 801–812. (10.1002/hipo.20327) - DOI - PMC - PubMed
    1. Burgess N. 2008. Grid cells and theta as oscillatory interference: theory and predictions. Hippocampus 18, 1157–1174. (10.1002/hipo.20518) - DOI - PMC - PubMed

Publication types

LinkOut - more resources