

Theta oscillations decrease spike synchrony in the hippocampus and entorhinal cortex
- PMID: 24366139
- PMCID: PMC3866449
- DOI: 10.1098/rstb.2012.0530
Theta oscillations decrease spike synchrony in the hippocampus and entorhinal cortex
Abstract
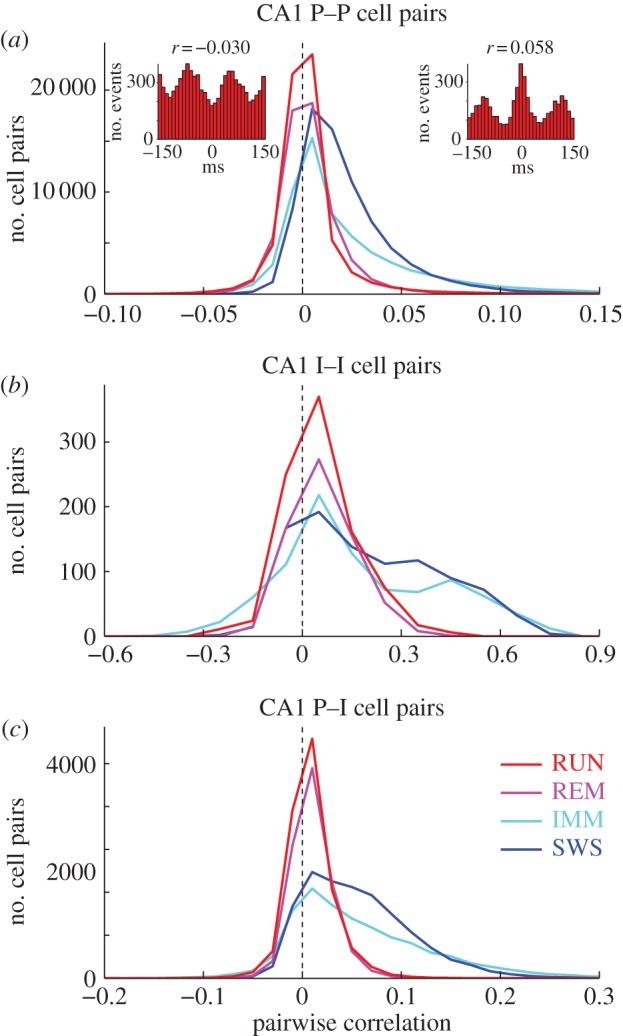
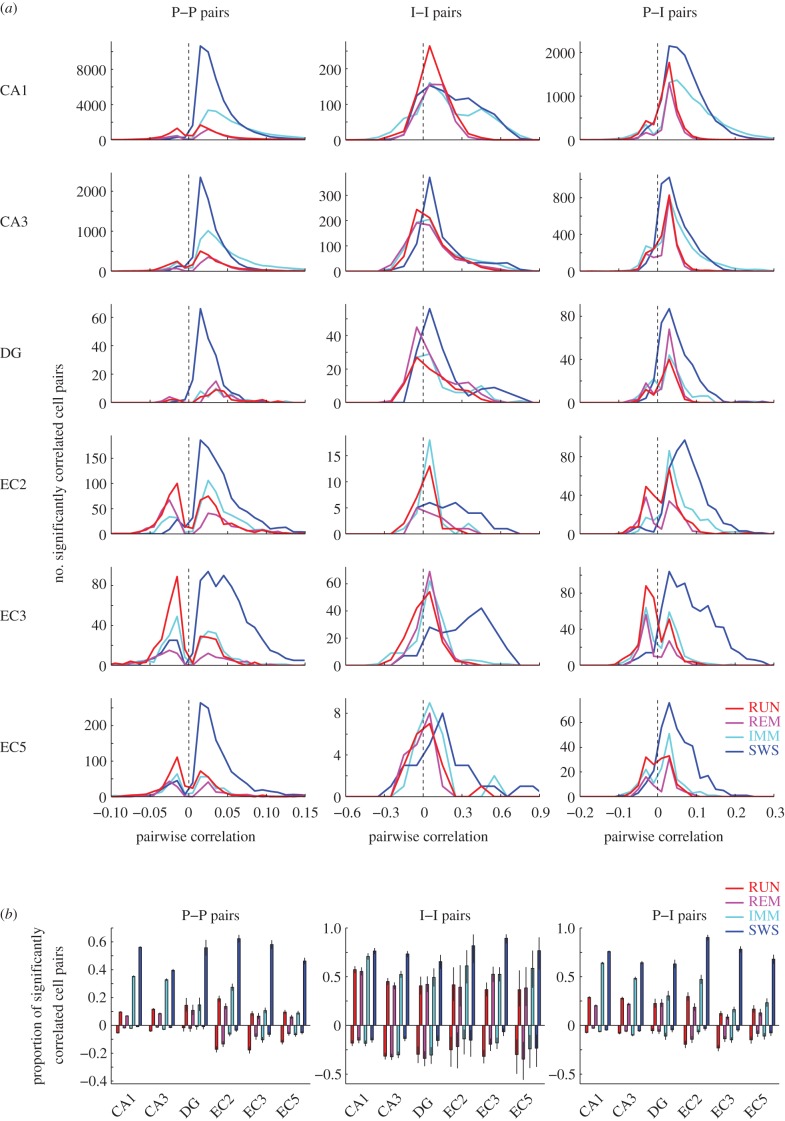
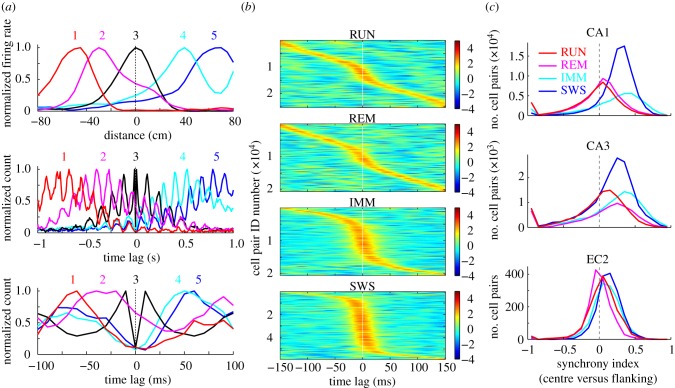
Oscillations and synchrony are often used synonymously. However, oscillatory mechanisms involving both excitation and inhibition can generate non-synchronous yet coordinated firing patterns. Using simultaneous recordings from multiple layers of the entorhinal-hippocampal loop, we found that coactivation of principal cell pairs (synchrony) was lowest during exploration and rapid-eye-movement (REM) sleep, associated with theta oscillations, and highest in slow wave sleep. Individual principal neurons had a wide range of theta phase preference. Thus, while theta oscillations reduce population synchrony, they nevertheless coordinate the phase (temporal) distribution of neurons. As a result, multiple cell assemblies can nest within the period of the theta cycle.
Keywords: brain states; cell assemblies; place cells; synchrony; temporal coordination; theta oscillations.
Figures
Similar articles
-
A distinctive subpopulation of medial septal slow-firing neurons promote hippocampal activation and theta oscillations.J Neurophysiol. 2011 Nov;106(5):2749-63. doi: 10.1152/jn.00267.2011. Epub 2011 Aug 24. J Neurophysiol. 2011. PMID: 21865435 Free PMC article.
-
Theta oscillations provide temporal windows for local circuit computation in the entorhinal-hippocampal loop.Neuron. 2009 Oct 29;64(2):267-80. doi: 10.1016/j.neuron.2009.08.037. Neuron. 2009. PMID: 19874793 Free PMC article.
-
Comparison of sleep spindles and theta oscillations in the hippocampus.J Neurosci. 2014 Jan 8;34(2):662-74. doi: 10.1523/JNEUROSCI.0552-13.2014. J Neurosci. 2014. PMID: 24403164 Free PMC article.
-
Spike Time Synchrony in the Absence of Continuous Oscillations.Neuron. 2018 Nov 7;100(3):527-529. doi: 10.1016/j.neuron.2018.10.036. Neuron. 2018. PMID: 30408441 Review.
-
A unified view of theta-phase coding in the entorhinal-hippocampal system.Curr Opin Neurobiol. 2007 Apr;17(2):197-204. doi: 10.1016/j.conb.2007.03.007. Epub 2007 Mar 26. Curr Opin Neurobiol. 2007. PMID: 17379502 Review.
Cited by
-
Establishing a Statistical Link between Network Oscillations and Neural Synchrony.PLoS Comput Biol. 2015 Oct 14;11(10):e1004549. doi: 10.1371/journal.pcbi.1004549. eCollection 2015 Oct. PLoS Comput Biol. 2015. PMID: 26465621 Free PMC article.
-
When two wrongs make a right: synchronized neuronal bursting from combined electrical and inhibitory coupling.Philos Trans A Math Phys Eng Sci. 2017 Jun 28;375(2096):20160282. doi: 10.1098/rsta.2016.0282. Philos Trans A Math Phys Eng Sci. 2017. PMID: 28507227 Free PMC article.
-
Degeneracy in hippocampal physiology and plasticity.Hippocampus. 2019 Oct;29(10):980-1022. doi: 10.1002/hipo.23139. Epub 2019 Jul 13. Hippocampus. 2019. PMID: 31301166 Free PMC article. Review.
-
CA1 Spike Timing is Impaired in the 129S Inbred Strain During Cognitive Tasks.Neuroscience. 2022 Feb 21;484:119-138. doi: 10.1016/j.neuroscience.2021.11.021. Epub 2021 Nov 17. Neuroscience. 2022. PMID: 34800576 Free PMC article.
-
Large-scale analysis reveals populational contributions of cortical spike rate and synchrony to behavioural functions.J Physiol. 2017 Jan 1;595(1):385-413. doi: 10.1113/JP272794. Epub 2016 Nov 7. J Physiol. 2017. PMID: 27488936 Free PMC article.
References
Publication types
MeSH terms
Grants and funding
LinkOut - more resources
Full Text Sources
Other Literature Sources
Research Materials
