. 2014 Feb 14;114(4):626-36.
doi: 10.1161/CIRCRESAHA.114.302562. Epub 2013 Dec 23.

A role for peroxisome proliferator-activated receptor γ coactivator-1 in the control of mitochondrial dynamics during postnatal cardiac growth

Affiliations

A role for peroxisome proliferator-activated receptor γ coactivator-1 in the control of mitochondrial dynamics during postnatal cardiac growth

Ola J Martin et al. Circ Res. .

Abstract

Rationale: Increasing evidence has shown that proper control of mitochondrial dynamics (fusion and fission) is required for high-capacity ATP production in the heart. Transcriptional coactivators, peroxisome proliferator-activated receptor γ coactivator-1 (PGC-1) α and PGC-1β, have been shown to regulate mitochondrial biogenesis in the heart at the time of birth. The function of PGC-1 coactivators in the heart after birth has been incompletely understood.

Objective: Our aim was to assess the role of PGC-1 coactivators during postnatal cardiac development and in adult hearts in mice.

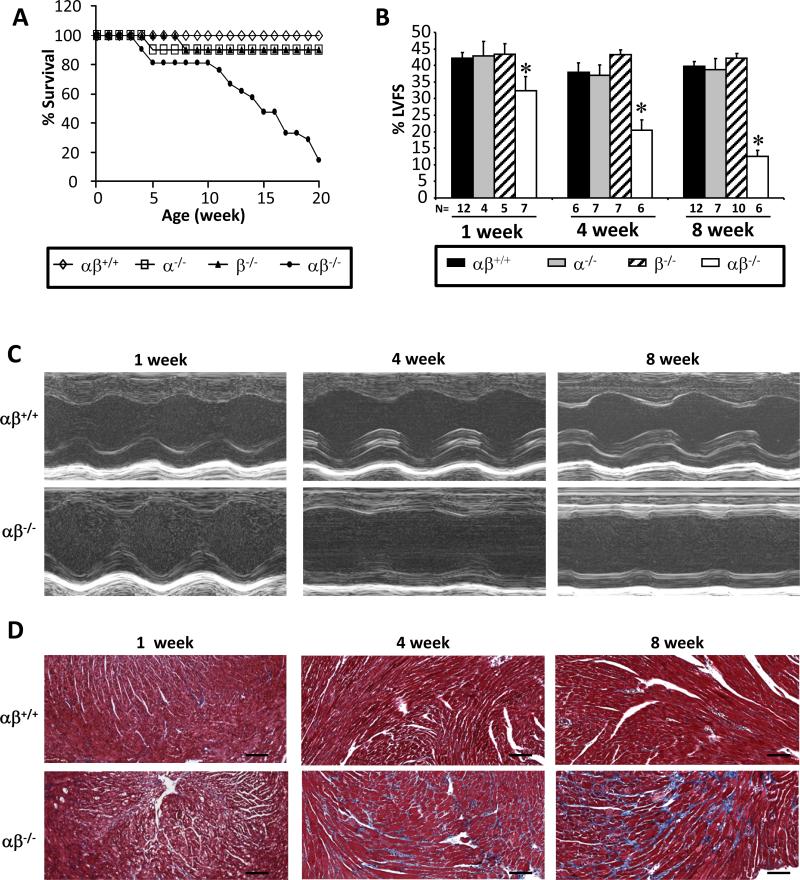
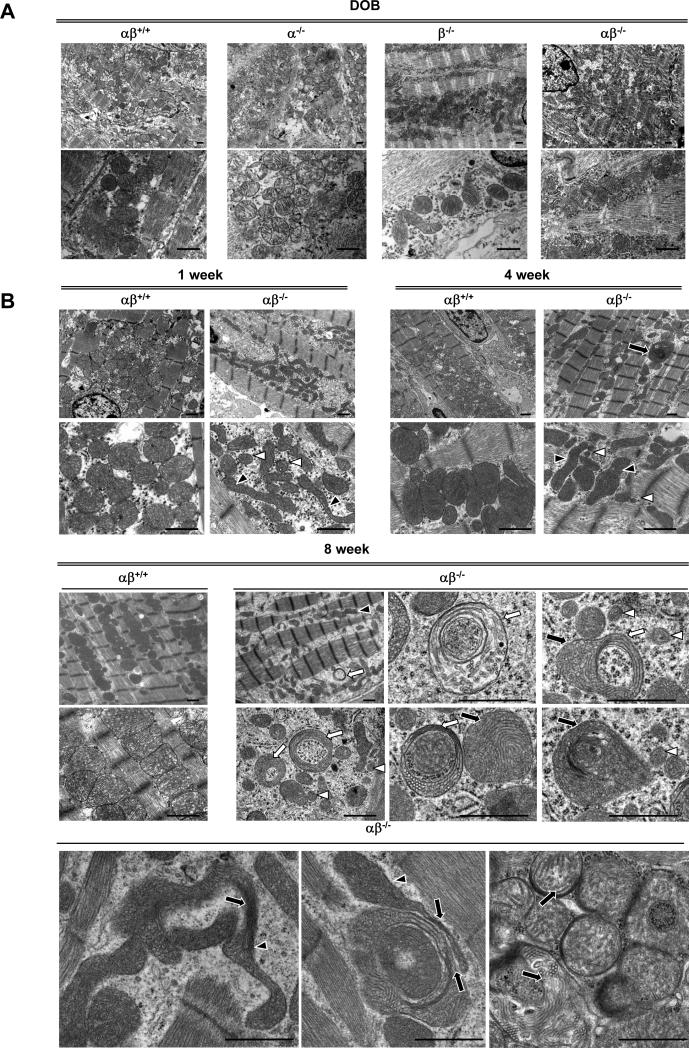
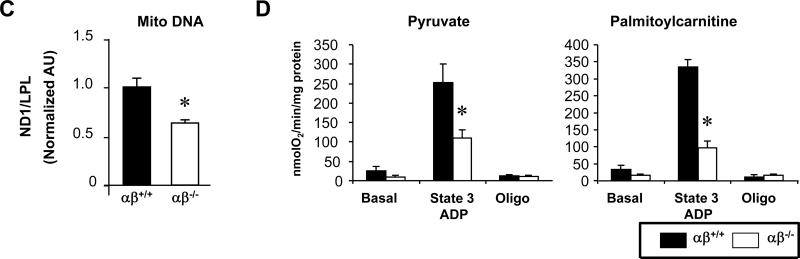
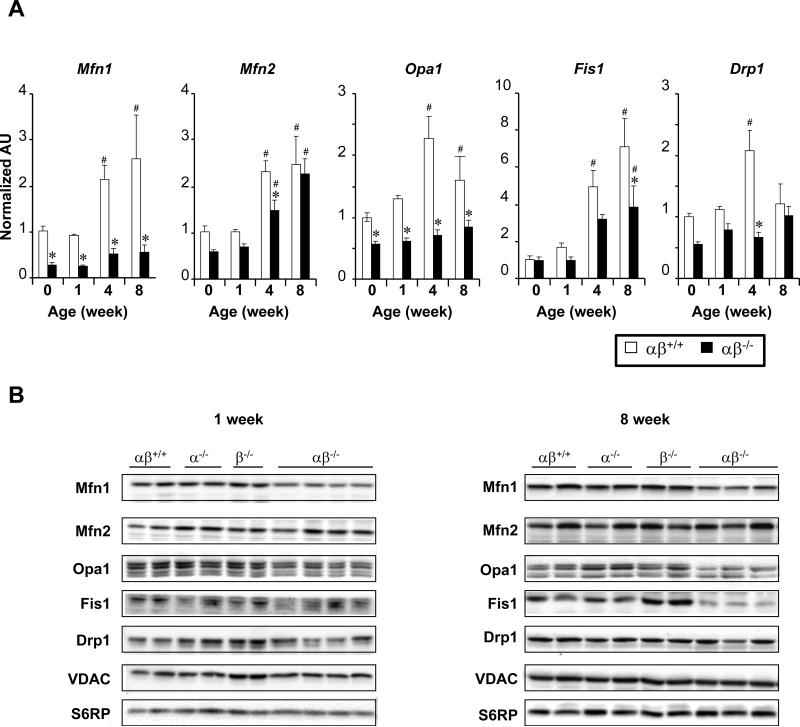
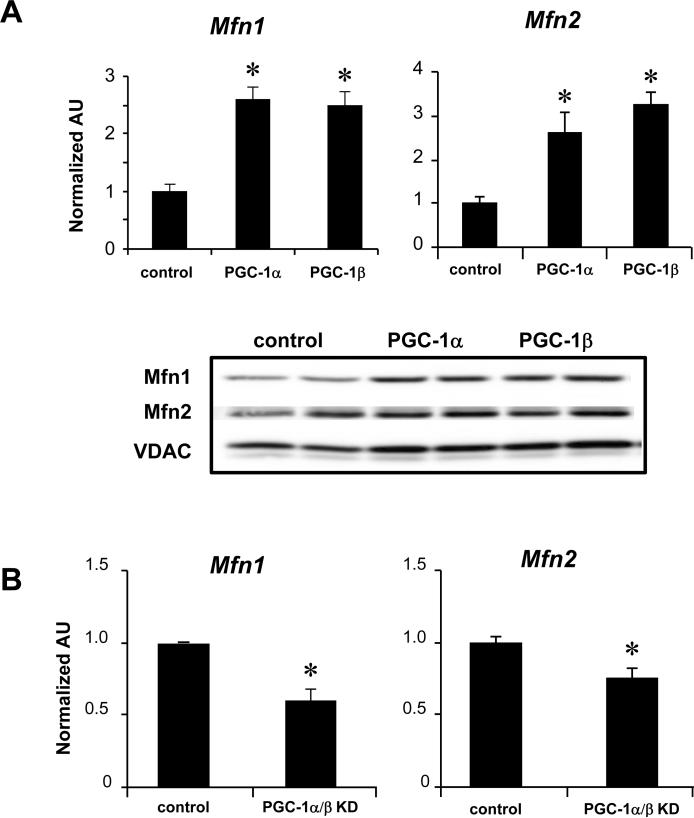
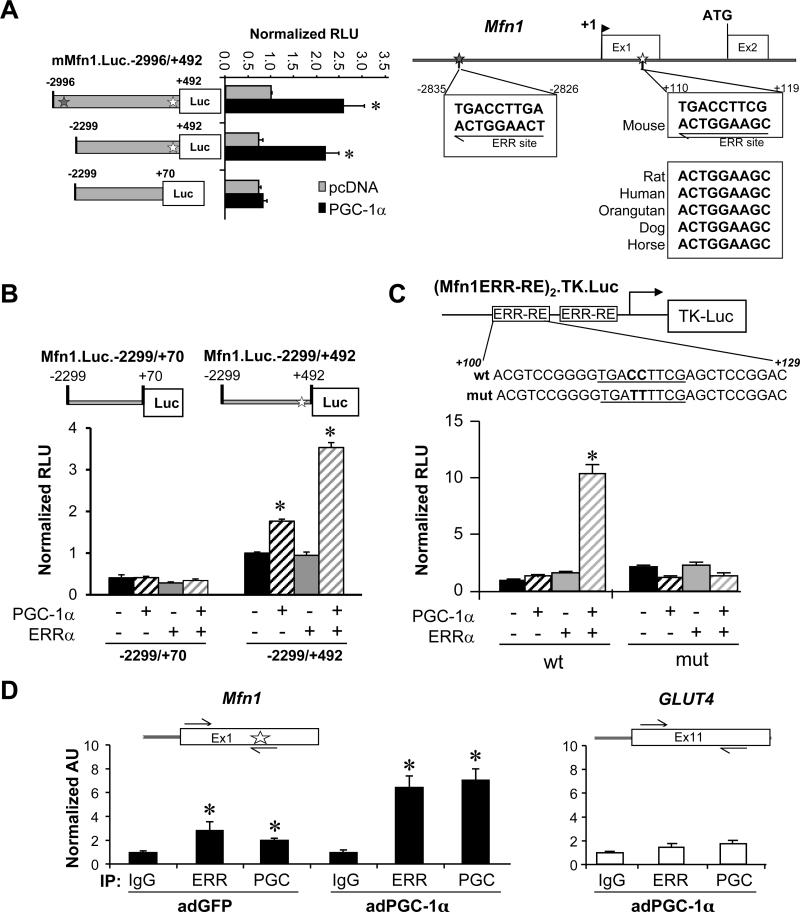
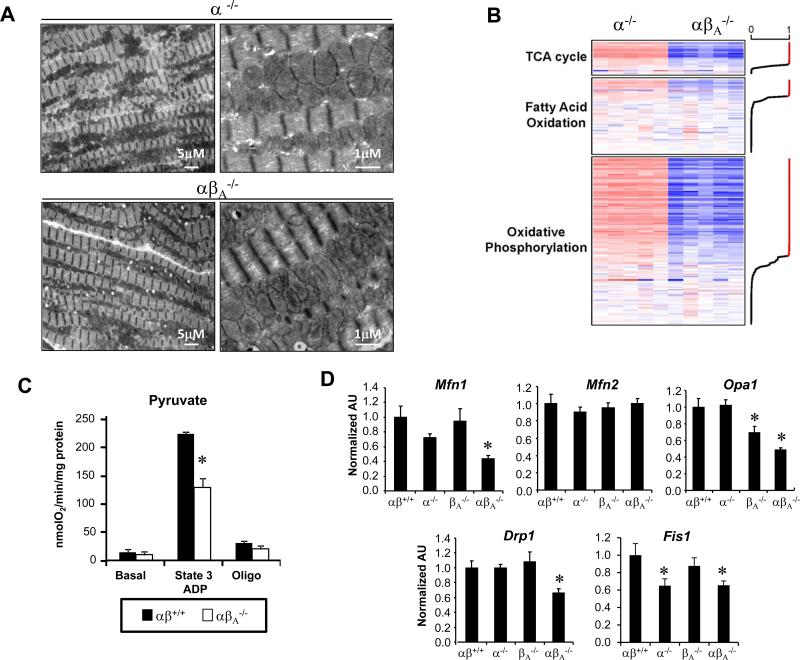
Methods and results: Conditional gene targeting was used in mice to explore the role of PGC-1 coactivators during postnatal cardiac development and in adult hearts. Marked mitochondrial structural derangements were observed in hearts of PGC-1α/β-deficient mice during postnatal growth, including fragmentation and elongation, associated with the development of a lethal cardiomyopathy. The expression of genes involved in mitochondrial fusion (Mfn1, Opa1) and fission (Drp1, Fis1) was altered in the hearts of PGC-1α/β-deficient mice. PGC-lα was shown to directly regulate Mfn1 gene transcription by coactivating the estrogen-related receptor α on a conserved DNA element. Surprisingly, PGC-1α/β deficiency in the adult heart did not result in evidence of abnormal mitochondrial dynamics or heart failure. However, transcriptional profiling demonstrated that PGC-1 coactivators are required for high-level expression of nuclear- and mitochondrial-encoded genes involved in mitochondrial dynamics and energy transduction in the adult heart.

Conclusions: These results reveal distinct developmental stage-specific programs involved in cardiac mitochondrial dynamics.

Keywords: Mfn1 protein, human; cardiomyopathies; mitochondrial dynamics.


Figures

Figure 1
Figure 1. PGC-1α−/−βf/f/MCK-Cre mice develop progressive postnatal cardiomyopathy
(A) Male and female mice were monitored for 20 weeks [PGC-1βf/f (αβ+/+, n=12), PGC-1α−/−βf/f−/−, n=10), PGC-1βf/f/MCK-Cre−/−, n=10), and PGC-1α−/−βf/f/MCK-Cre (αβ−/−, n=21)]. Graph denotes survival rates as a function of age (p<0.0001 based on Log-rank test). There was no significant difference in the longevity of male vs. female αβ−/− mice. (B) Left ventricular (LV) fractional shortening (FS) was determined using echocardiography for 1, 4, and 8 week-old mice. 1 week-old data represents male and female mice, n=4-12 mice per genotype. 4 and 8 week-old data represent female mice, n=6-12 mice per genotype. *p<0.05 relative to αβ+/+. (C) Representative M-mode echocardiographic images from 1, 4, and 8 week-old αβ+/+ and αβ−/− mice are shown. (D) Representative images of Mason’s trichrome staining of myocardial left ventricular sections from 1, 4, and 8 week-old PGC-1αβ+/+ and PGC-1αβ−/− mice are shown. Scale bars are 100 μm.
Figure 2
Figure 2. Progressive cardiac mitochondrial structural and functional derangements develop in PGC-1α−/−βf/f/MCK-Cre mice
(A) Representative electron micrograph images taken from the LV free wall of animals on day of birth (DOB). Low magnification images were used to evaluate mitochondrial density, and high magnification images were used to determine mitochondrial structure. Images from 4 animals of each genotype were examined. Scale bars are 1μm. (B) Representative EMs of LV free wall of 1 week-old mice, and papillary muscle of 4 and 8 week-old mice from the genotypes indicated are shown. Arrows indicate structurally abnormal mitochondria including mitochondria with abnormal cristae structure (black arrows), elongated (black arrowheads), “donut-shaped” (white arrows), and small fragmented mitochondria (white arrowheads). (C) PCR of DNA from heart of PGC-1βf/f (αβ+/+) vs. PGC-1α−/−βf/f/MCK-Cre (αβ−/−) mice was performed to quantify mitochondrial DNA using primers for NADH dehydrogenase (ND1) normalized to genomic DNA using primers for lipoprotein lipase (LPL). The ND1 levels were normalized to genomic DNA content. Bars represent mean ± SEM. *p< 0.05. (D) Bars represent mean (± SEM) mitochondrial respiration rates determined on mitochondria isolated from the entire heart ventricle of 4 week-old female mice from the indicated genotypes. Rates were measured using a fluorescence-based oxygen sensing probe (FOXY, Ocean Optics) with either pyruvate or palmitoylcarnitine as substrate under the following conditions: basal, state 3 (ADP stimulated), and oligomycin-induced state 4 (oligo). *p<0.05 relative to αβ+/+.
Figure 3
Figure 3. Reduced expression of genes involved in mitochondrial dynamics in PGC-1α−/−βf/f/MCK-Cre (αβ−/−) heart
(A) Results of qRT-PCR analysis performed on RNA isolated from hearts of PGC-1βf/f (αβ+/+) vs. PGC-1α−/−βf/f/MCK-Cre (αβ −/−) mice from birth (0 weeks) to 8 weeks of age [mitofusin 1(Mfn1), mitofusin 2 (Mfn2), dynamin-related protein 1 (Drp1), optic atrophy 1(Opa1)]. The average of results from 4 animals per group is shown. *p<0.05 relative to corresponding αβ+/+, #p<0.05 relative to the week 0 timepoint of the corresponding genotype. (B) Representative Western blot analyses performed using protein extracts prepared from 1 and 8 week-old mouse heart ventricle tissue homogenate from genotypes denoted at the top. Voltage-dependent anion channel (VDAC) and S6 ribosomal protein (S6RP) were used as loading controls.
Figure 4
Figure 4. Induction of Mfn1 and Mfn2 expression by PGC-1α and PGC-1β
(A, top) qRT-PCR analysis was performed to quantify the Mfn1 and Mfn2 transcripts in NRCM after adenoviral-mediated overexpression of PGC-1α, PGC-1β, or GFP control. Bars represent the mean (±SEM) of 3 independent experiments, *p<0.05 relative to control. (bottom) Representative Western blot analyses using whole cell protein extracts after adenoviral-mediated overexpression of PGC-1α or β in H9c2 myotubes. (B) Results of qRT-PCR analysis to quantify Mfn1 and Mfn2 transcripts in NRCM after shRNA-mediated knockdown (KD) of PGC-1α and β [the shRNAs resulted in significant KD of PGC-1α (84%) and PGC-1β (67%)]. Bars represent the mean (±SEM) of 3 independent experiments, *p<0.05.
Figure 5
Figure 5. PGC-1α coactivates ERRα to increase transcription of the Mfn1 gene
(A, left) Serial deletion reporter constructs were transfected into C2C12 myotubes in the presence of overexpressed PGC-1α (black bars) or vector backbone control (pcDNA3.1; gray bars). The bars represent mean luciferase activity (normalized relative light units, RLU) ±SEM. Gray (-2826) or white (+110) stars denote the position of putative ERR sites. *p<0.05. (right) Putative ERRα binding consensus site sequences. The positions of the putative ERR binding sites are denoted by stars. DNA sequence conservation between species is shown in the boxes. (B) Bars denote RLU of the Mfn1.Luc.-2299/+70 or the Mfn1.Luc.-2299/+492 reporter in the presence or absence of expressed PGC-1α and/or ERRα in C3H10T1/2 cells. *p<0.05 compared to reporter alone. (C) C3H10T1/2 cells were transfected with a reporter construct containing two copies of the short nucleotide fragment containing the conserved ERRα site (or a mutated version of the site) upstream of the TK promoter in the presence or absence of overexpressed PGC-1α and/or ERRα. Bars represent mean normalized RLU ±SEM for 3 independent experiments. *p<0.05. (D) Quantification of ChIP assays performed with H9c2 myotubes following infection by adPGC-1α or control virus using anti-PGC-1α, anti-ERRα, or IgG (negative control) as shown at the bottom. Schematics above the graphs indicate the relative positions of primers used for amplification (black arrows), and the relative position of the conserved ERR-RE (white star). Bars represent SYBR green quantification of 3 independent chromatin isolations and immunoprecipitations (arbitrary units ± SEM) normalized to the value for the IgG control (taken as 1.0). *p< 0.05 compared to IgG control.
Figure 6
Figure 6. Global downregulation of genes involved in mitochondrial pathways in hearts of adult PGC-1α−/−βf/f/MerCre mice
(A) Representative EMs of adult (A) PGC-1α−/−βf/f/MerCre−/−) or PGC-1α−/−βf/f/MerCre (αβA−/−) hearts taken from the papillary muscle of 4 month old female mice, 2 months following IP injection of tamoxifen or control. Images are representative of 3 animals per group. Scale bars are 5μm or 1mm, as indicated. (B) Heat map of Affymetrix Gene Chip profiling data representing genes within regulated mitochondrial pathways from cardiac tissue of 2-3 month old PGC-1α−/−βf/f/MerCre mice, 1 month after vehicle (α−/−) or tamoxifen injection (αβA−/−). Genes are ordered by the posterior probability (PP) of differential expression (DE) between α−/− and αβA−/−. Red indicates upregulation and blue indicates downregulation relative to the α−/− control animals. The line graph on the right margin shows the PP values for each gene; red indicates PP>0.949. (C) Bars represent mean (± SEM) mitochondrial respiration rates determined on mitochondria isolated from the entire heart ventricle of 2-3 month old control PGC-1αβ+/+ (αβ+/+) mice vs. PGC-1α−/−βf/f/MerCre (αβA−/−) mice, 1 month after injection with vehicle or tamoxifen (depending on the genotype). Rates were measured using Seahorse Bioscience XF96 Analyzer with pyruvate as a substrate under the following conditions: basal, state 3 (ADP stimulated), and oligomycin-induced state 4 (oligo). *p<0.05 relative to αβ+/+. (D) qRT-PCR analysis was performed to quantify levels of mRNA encoding fission/fusion proteins in cardiac tissue in 2-3 month old control PGC-1αβ+/+ (αβ+/+), PGC-1βf/f/MerCreA−/−), PGC-1α−/−−/−), PGC-1α−/−−/−), PGC-1α−/−βf/f/MerCre (αβA−/−) mice, 1 month after injection with vehicle or tamoxifen (depending on the genotype). The bars represent mean ± SEM values. *p<0.05 relative to αβ+/+.

References

    1. Ventura-Clapier R, Garnier A, Veksler V, Joubert F. Bioenergetics of the failing heart. Biochim Biophys Acta. 2011;1813:1360–1372. - PubMed
    1. Kelly DP, Scarpulla RC. Transcriptional control of striated muscle mitochondrial biogenesis and function. In: Hill JA, Olson EN, editors. Muscle: Fundamental biology and mechanisms of disease. Elsevier Academic Press; London: 2012. pp. 203–215.
    1. Neubauer S. The failing heart--an engine out of fuel. N Engl J Med. 2007;356:1140–1151. - PubMed
    1. Lopaschuk GD, Jaswal JS. Energy metabolic phenotype of the cardiomyocyte during development, differentiation, and postnatal maturation. J Cardiovasc Pharmacol. 2010;56:130–140. - PubMed
    1. Warshaw JB, Terry ML. Cellular energy metabolism during fetal development. II. Fatty acid oxidation by the developing heart. J Cell Biol. 1970;44:354–360. - PMC - PubMed

Publication types

Substances