. 2014 Feb 15;592(4):669-93.
doi: 10.1113/jphysiol.2013.267872. Epub 2013 Dec 23.

Complementary functions of SK and Kv7/M potassium channels in excitability control and synaptic integration in rat hippocampal dentate granule cells

Affiliations

Complementary functions of SK and Kv7/M potassium channels in excitability control and synaptic integration in rat hippocampal dentate granule cells

Pedro Mateos-Aparicio et al. J Physiol. .

Abstract

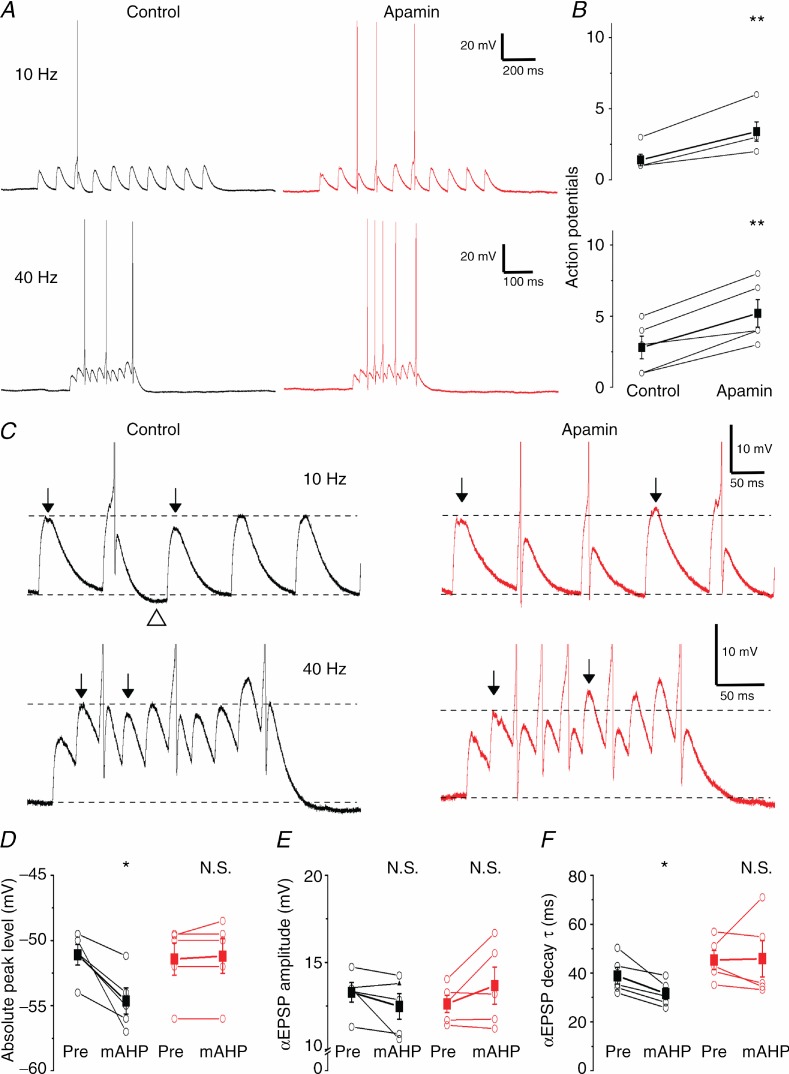
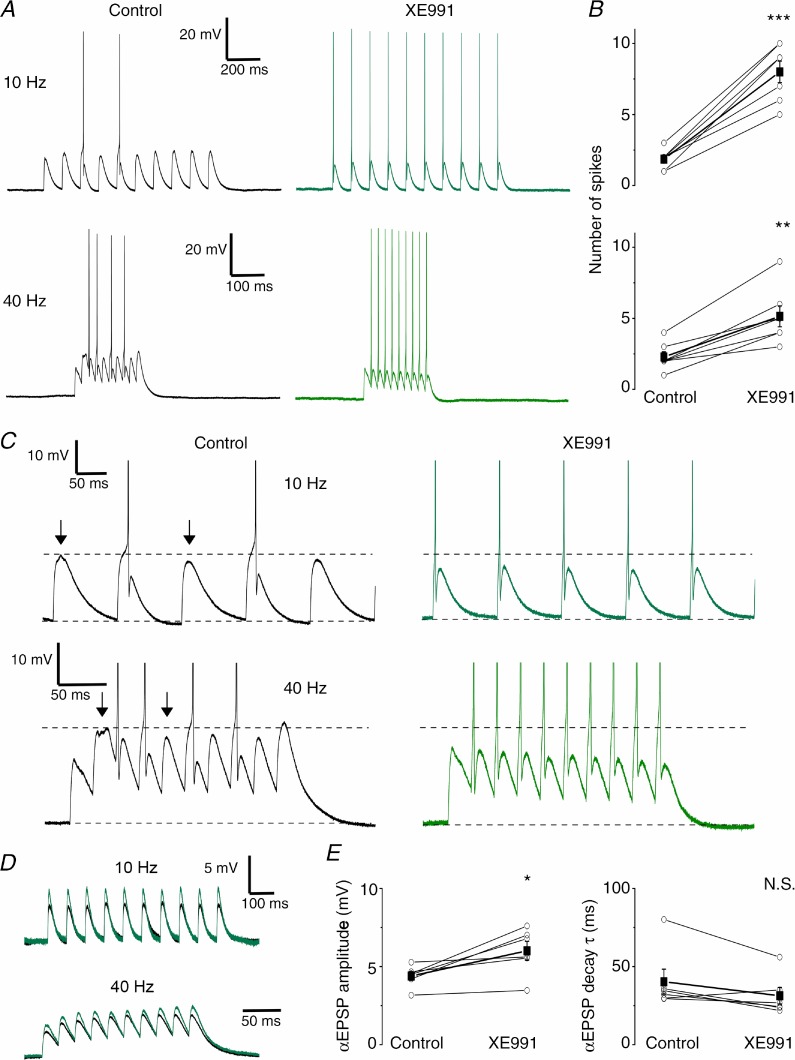
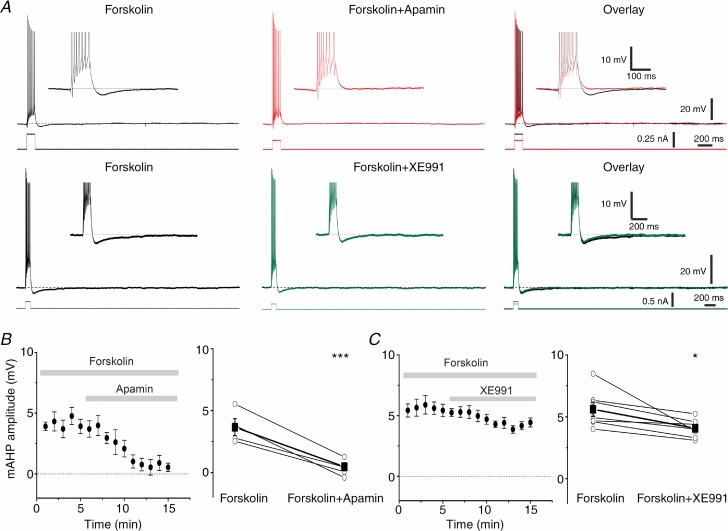
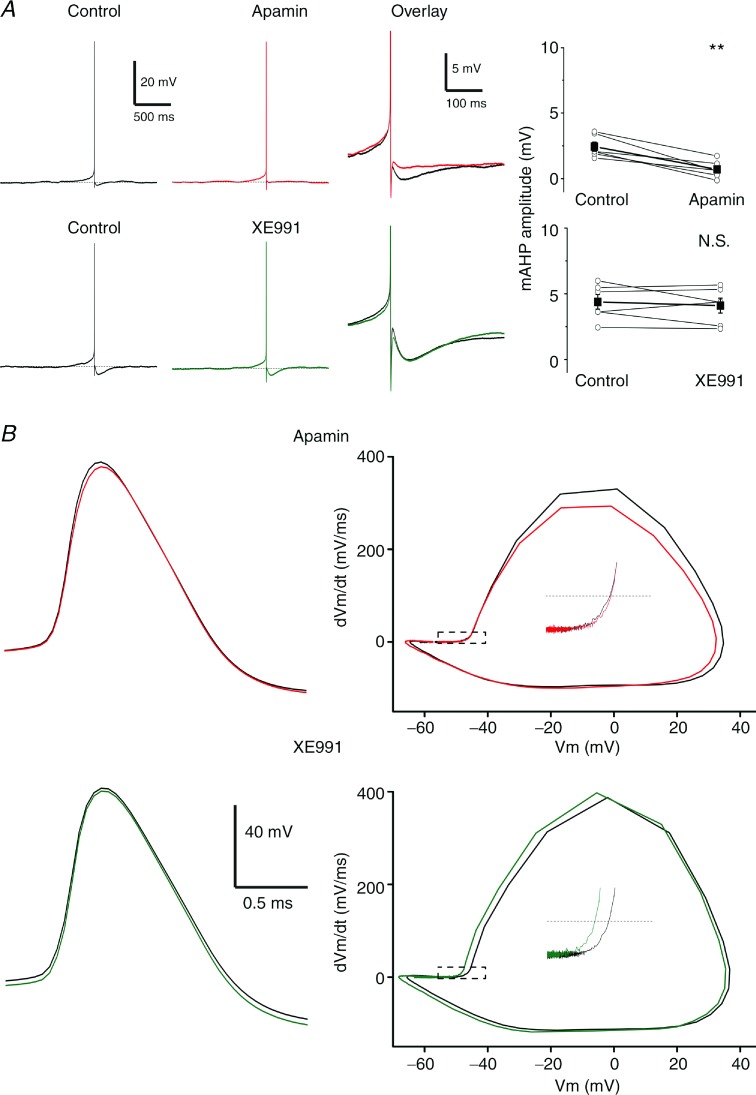
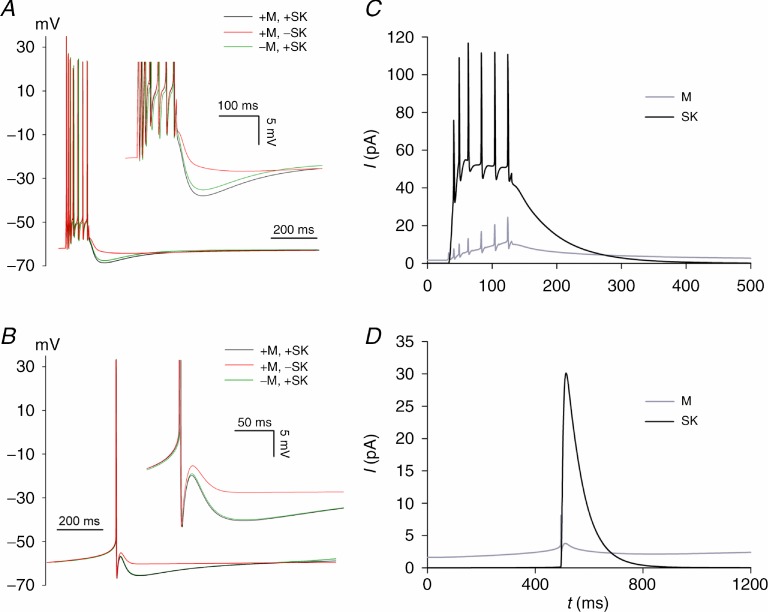
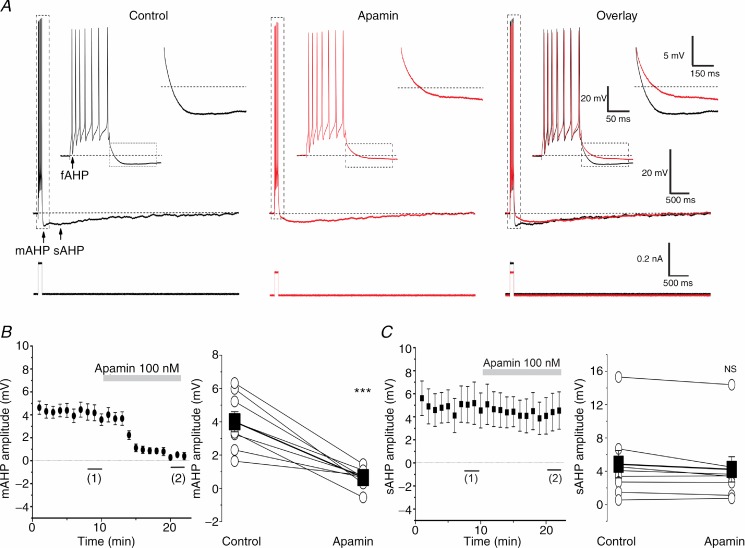
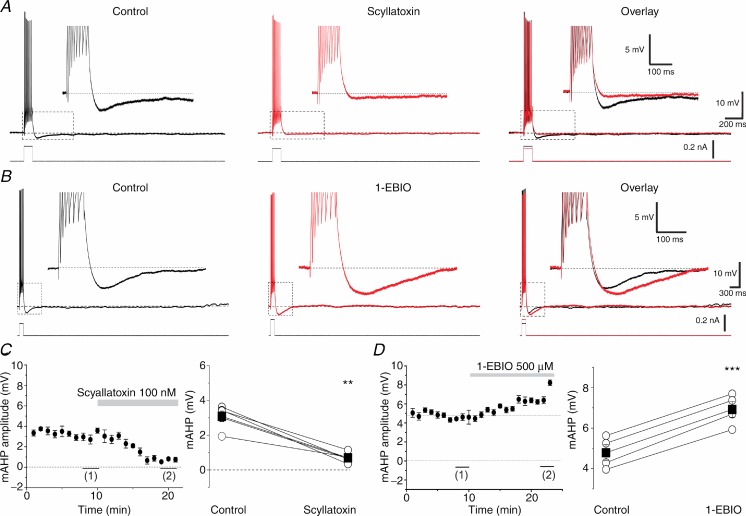
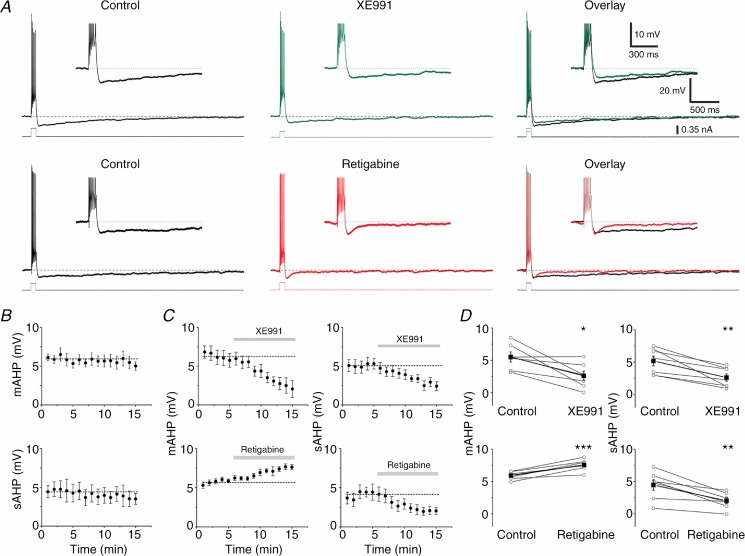
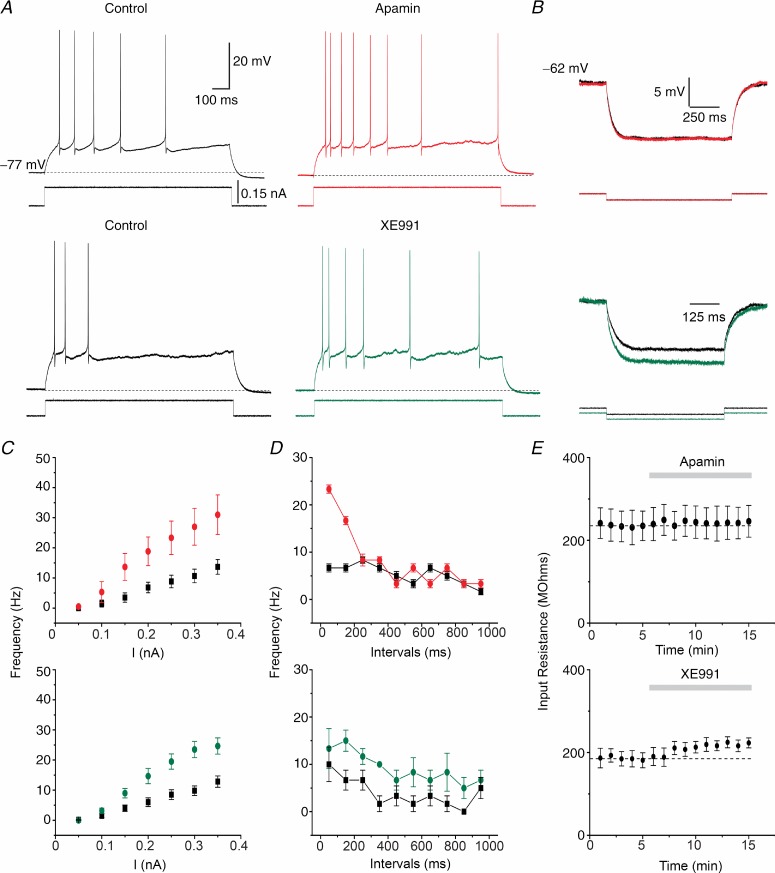
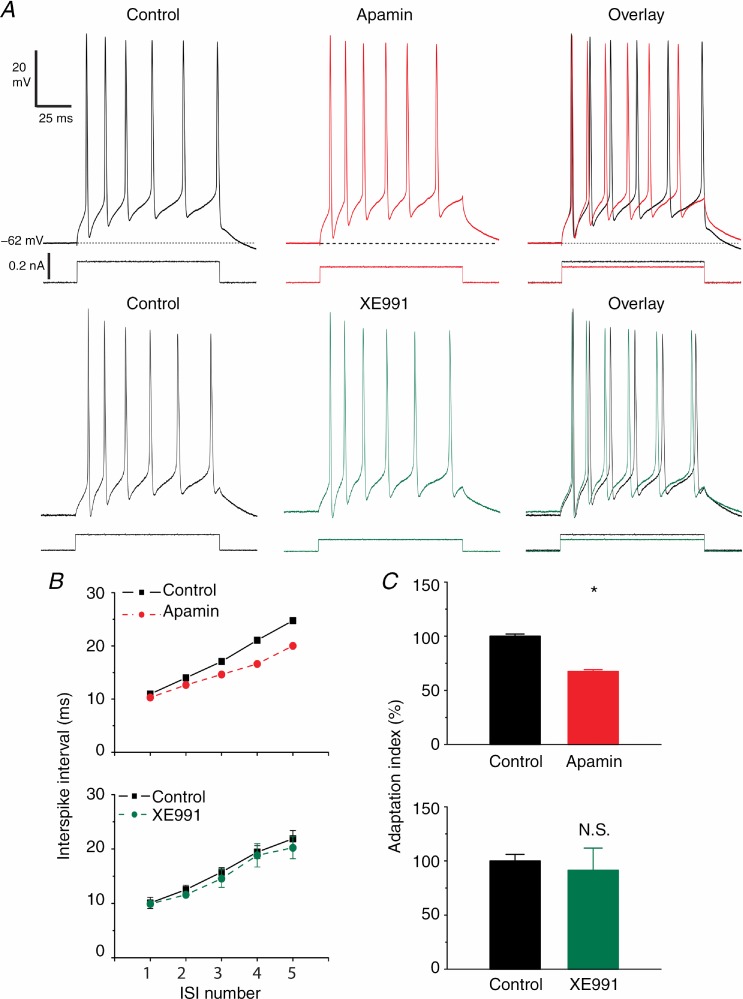
The dentate granule cells (DGCs) form the most numerous neuron population of the hippocampal memory system, and its gateway for cortical input. Yet, we have only limited knowledge of the intrinsic membrane properties that shape their responses. Since SK and Kv7/M potassium channels are key mechanisms of neuronal spiking and excitability control, afterhyperpolarizations (AHPs) and synaptic integration, we studied their functions in DGCs. The specific SK channel blockers apamin or scyllatoxin increased spike frequency (excitability), reduced early spike frequency adaptation, fully blocked the medium-duration AHP (mAHP) after a single spike or spike train, and increased postsynaptic EPSP summation after spiking, but had no effect on input resistance (Rinput) or spike threshold. In contrast, blockade of Kv7/M channels by XE991 increased Rinput, lowered the spike threshold, and increased excitability, postsynaptic EPSP summation, and EPSP-spike coupling, but only slightly reduced mAHP after spike trains (and not after single spikes). The SK and Kv7/M channel openers 1-EBIO and retigabine, respectively, had effects opposite to the blockers. Computational modelling reproduced many of these effects. We conclude that SK and Kv7/M channels have complementary roles in DGCs. These mechanisms may be important for the dentate network function, as CA3 neurons can be activated or inhibition recruited depending on DGC firing rate.


Figures

Figure 9
Figure 9
A, representative examples showing the effect of SK channel blockade on subthreshold summation recorded at 36°C. αEPSPs were injected at 10 and 40 Hz into the somatic compartment while keeping the neuron depolarized near AP threshold. B, SK channel blockade significantly increased the number of spikes during a 10 αEPSP train both at 10 and 40 Hz (n = 5, P < 0.01 (**)). C, examples shown in A at higher magnification clearly show the reduced summation of αEPSPs during the mAHP and the dramatic increase after apamin application. Top arrows show αEPSPs before and during the mAHP. Note the undershoot due to the mAHP (open triangle). D, E and F, summary plots comparing the absolute peak level, amplitude and decay time constant (τ) of the αEPSP before the first AP (‘Pre’) and the first αEPSP after the first AP and associated mAHP (‘mAHP’) in control and apamin conditions. The mAHP significantly reduced the absolute αEPSP peak (D) and decay time constant (τ) (F) (n = 5, P < 0.05 (*)) under control conditions but apamin abolished this difference.
Figure 10
Figure 10
A, typical examples of αEPSP trains at 10 (upper traces) and 40 Hz (bottom traces) before (black) and after application of 10 μm XE991 (green). B, summary plots of the number of spikes elicited by the αEPSP trains. XE991 significantly increased the number of action potentials both at 10 (n = 7, P < 0.001 (***)) and 40 Hz (n = 7, P < 0.01 (**)). C, examples shown in A at higher magnification show the reduced αEPSP absolute peak level during the mAHP (control, arrows, black traces) and the increased number of APs after XE991 (green). D, typical examples of subthreshold αEPSP trains evoked at 10 and 40 Hz during the control period (black) and after XE991 application (green). E, XE991 significantly increased the subthreshold αEPSP amplitude (n = 6, P < 0.05 (*); left panel) while having no clear effect on the αEPSP decay time constant (τ) (n = 6, P > 0.05; right panel).
Figure 4
Figure 4
A, typical traces showing the effect of apamin (100 nm, top traces) on the isolated mAHP after sAHP suppression by forskolin (50 μm); bottom traces show representative examples of the effect of XE991 (10 μm) on the isolated mAHP. B, averaged time plot (n = 5, left panel) showing the effect of apamin on the time course of the isolated mAHP. Summary plot (right panel) showing the individual and mean values before and after application of apamin (n = 5, P < 0.001 (***)). C, similar plots summarizing the effect of XE991 on the isolated mAHP (n = 7, P < 0.05 (*)). Note the smaller mAHP reduction after Kv7/M channel blockade compared to SK channel blockade.
Figure 5
Figure 5
A, typical examples of single AP elicited by steady depolarization near the spike threshold. In control conditions (black trace), the spontaneous AP was followed by a fAHP and mAHP. Bath application of 100 nm apamin (red) effectively blocked the mAHP, while 10 μm XE991 (green) had little or no effect on the mAHP amplitude. Right panel shows individual and averaged values for the mAHP under control and apamin (n = 6, P < 0.01 (**)) or XE991 (n = 6, P > 0.05 (NS)) conditions. B, left, overlay of averaged single APs under control (black) and apamin (red) or XE991 (green) conditions. Right, phase plots showing the dV/dt of the AP waveform plotted against the voltage. Upper panel shows that application of apamin (red) did not affect the AP threshold while XE991 (bottom panel, green) had a hyperpolarizing effect.
Figure 6
Figure 6
A and B show plots of V(t) with ‘+’ and ‘−’ indicating ‘presence’ and ‘absence’ of the M-and SK-conductances. These plots should be compared with the experimental data in Figs 4 and 5. C and D show plots of the currents ISK(t) and IM(t) (both integrated over the model neuron) for the +M, +SK regime.
Figure 1
Figure 1
A, typical examples of whole-cell current clamp recordings from a DGC showing repetitive spiking in response to a depolarizing current pulse (100 ms long) before (black) and after (red) bath application of 100 nm apamin. The APs are followed by fAHP, mAHP and sAHP. The background membrane potential prior to stimulation was kept at –62 mV (dashed line) by depolarizing holding current injection, and the current pulse amplitude was adjusted to produce a train of seven APs. The insets show expanded traces from the marked periods (dashed rectangles). Note that apamin suppressed the mAHP, but had essentially no effect on the sAHP. B, left, time course of the effect of apamin on the mAHP peak amplitude (n = 8). The summary graph (right) shows the effect of apamin (n = 8, P < 0.001 (***)) on the mAHP in all cells tested (○) and the mean value (▪). C shows that apamin had no significant effect on the sAHP peak amplitude (n = 8, P > 0.05 (NS)). For the analysis, the mean AHP amplitudes during the last 3 min (1) before apamin application were compared to the last 3 min after full effect of apamin (2).
Figure 2
Figure 2
A, typical examples showing the mAHP under control (black) and 100 nm scyllatoxin application (red). The overlay shows the mAHP effectively blocked after toxin application. B, the mAHP was enhanced by 500 μm 1-EBIO application. Both the mAHP amplitude and duration were increased after 1-EBIO application (red) compared to control traces (black). Note the increased positive current step injected to evoke a train of seven APs after 1-EBIO application. C, time course showing the effect of 100 nm scyllatoxin application during the recording time (n = 5, left panel). Summary graph of the five cells tested with this toxin (right panel) showing the comparison between control period (1) and values with full effect (2), measured in the time plot (n = 5, P < 0.01 (**)). D, similar analysis of the data in B, showing enhancement of the mAHP after 1-EBIO application (n = 5, P < 0.001 (***)).
Figure 3
Figure 3
A, representative examples showing the effect of Kv7/M channel blockade (top traces) by XE991 (10 μm). Bottom traces show the effect of the Kv7/M channel opener retigabine (10 μm) on both the mAHP and sAHP. Note the reduction in holding current and depolarizing step after application of XE991 and the increase in the depolarizing step after application of retigabine. B, time plots for both the mAHP and sAHP amplitudes in a subset of cells (n = 5) recorded under control conditions, to test the stability of AHPs in our experimental conditions. Dashed lines represent the mean values during the ‘control’ period (first 5 min), in the case of drug application. C, averaged time plots of the experiments shown in A for both the mAHP and sAHP. D, summary graphs showing the effect of both XE991 (n = 7, P < 0.05 (*), P < 0.01 (**), top panels) and retigabine (n = 6, P < 0.001 (***), P < 0.01 (**), bottom panels) on the mAHP (left) and the sAHP (right).
Figure 7
Figure 7
A, typical traces from two DGCs firing in response to 1 s-long depolarizing current injection (0.15 nA) at a clamped membrane potential of –77 mV. Compared to control conditions (black), 100 nm apamin (red) and 10 μm XE991 (green) increased the firing frequency response of each cell. B, representative examples comparing the voltage responses to –50 pA steps at subthreshold potential of –62 mV between control (black) and apamin (red) or XE991 (green). C, f–I plots of the DGC responses in experiments as shown in A (n = 6, Apamin; n = 6, XE991). The firing frequencies were augmented after 100 nm apamin or 10 μm XE991. D, averaged firing frequencies measured within 100 ms time windows during 1 s, 0.15 nA current pulses. Apamin (top panel) significantly increased the firing frequency during the first 200 ms of the pulse without affecting the late phase of the response. However, XE991 (bottom panel) increased the frequency during the whole 1 s response, including the late phase. E, time course of the Rinput measured in B showing no significant changes over time and after apamin (top) application. However, XE991 increased the Rinput (bottom).
Figure 8
Figure 8
A, apamin (100 nm) reduced the early spike frequency adaptation at depolarized membrane potentials (–62 mV) in DGCs (top traces, red). 100 ms long depolarizing current pulses (see Methods) evoked bursts of six APs once every minute. The first to fifth ISIs were measured before and after apamin application. In order to obtain comparable responses with six APs, the current pulse amplitude was reduced to compensate for the increased excitability due to the mAHP blockade. However, XE991 (bottom traces, green) had little effect on early spike frequency adaptation. B, summary data of ISI duration in control conditions and after apamin (n = 8; top red plot) and XE991 (n = 5; bottom green plot) applications. Note the reduction in the third to fifth ISI duration after SK channel blockade. C, normalized adaptation index (defined as the slope of the line that fitted best to the plot of the first to fifth ISI, as shown in B) in control conditions (black) and after apamin (red) and XE991 (green) application. Apamin significantly reduced the adaptation index compared to control conditions (n = 8, P < 0.05 (*)), while XE991 had little effect (not significant; n = 5, P > 0.05).

Similar articles

Cited by

References

    1. Adams PR, Constanti A, Brown DA, Clark RB. Intracellular Ca2+ activates a fast voltage-sensitive K+ current in vertebrate sympathetic neurones. Nature. 1982;296:746–749. - PubMed
    1. Adams PR, Jones SW, Pennefather P, Brown DA, Koch C, Lancaster B. Slow synaptic transmission in frog sympathetic ganglia. J Exp Biol. 1986;124:259–285. - PubMed
    1. Adelman JP, Maylie J, Sah P. Small-conductance Ca2+-activated K+ channels: form and function. Annu Rev Physiol. 2012;74:245–269. - PubMed
    1. Alle H, Ostroumov K, Geiger J, Storm JF. Neuroscience Meeting Planner. Chicago, IL, USA: Society for Neuroscience; 2009. M-current, persistent Na+ current, and subthreshold resonance recorded in mossy fiber boutons (MFBs) in rat hippocampus. Program No. 42.2/D10. 2009 Online.
    1. Andrade R, Foehring RC, Tzingounis AV. The calcium-activated slow AHP: cutting through the Gordian knot. Front Cell Neurosci. 2012;6:47. - PMC - PubMed

Publication types

MeSH terms

LinkOut - more resources