

Diffusion-weighted and multiphase contrast-enhanced MRI as surrogate markers of response to neoadjuvant sunitinib in metastatic renal cell carcinoma
- PMID: 24366299
- PMCID: PMC3915138
- DOI: 10.1038/bjc.2013.790
Diffusion-weighted and multiphase contrast-enhanced MRI as surrogate markers of response to neoadjuvant sunitinib in metastatic renal cell carcinoma
Abstract
Background: Current imaging criteria for categorising disease response in metastatic renal cell carcinoma (mRCC) correlate poorly with overall survival (OS) in patients on anti-angiogenic therapies. We prospectively assess diffusion-weighted and multiphase contrast-enhanced (MCE) MR imaging (MRI) as markers of outcome.
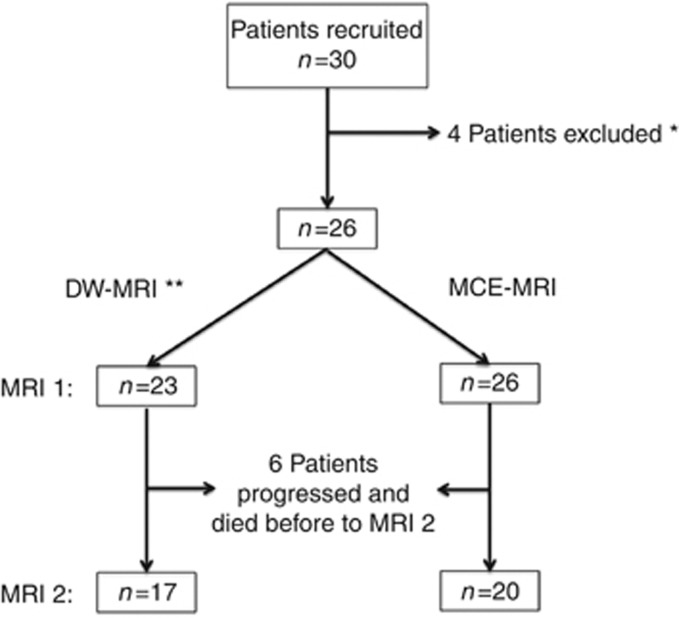
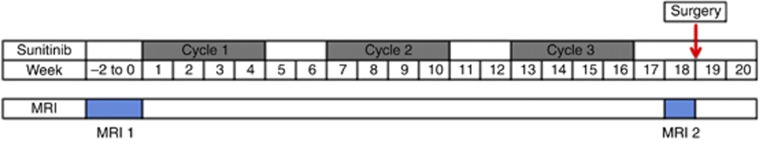
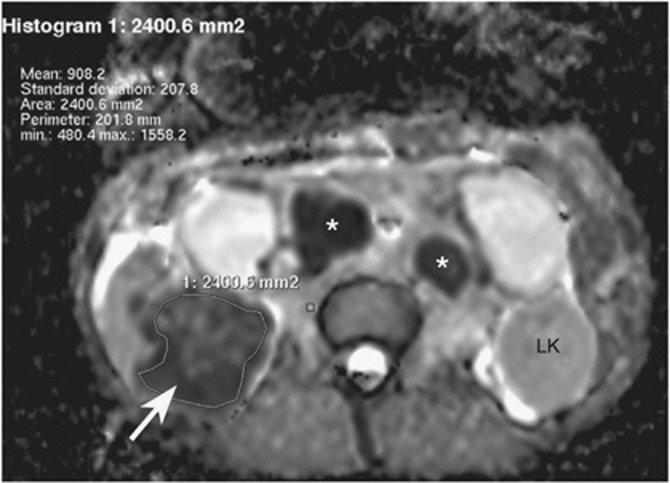
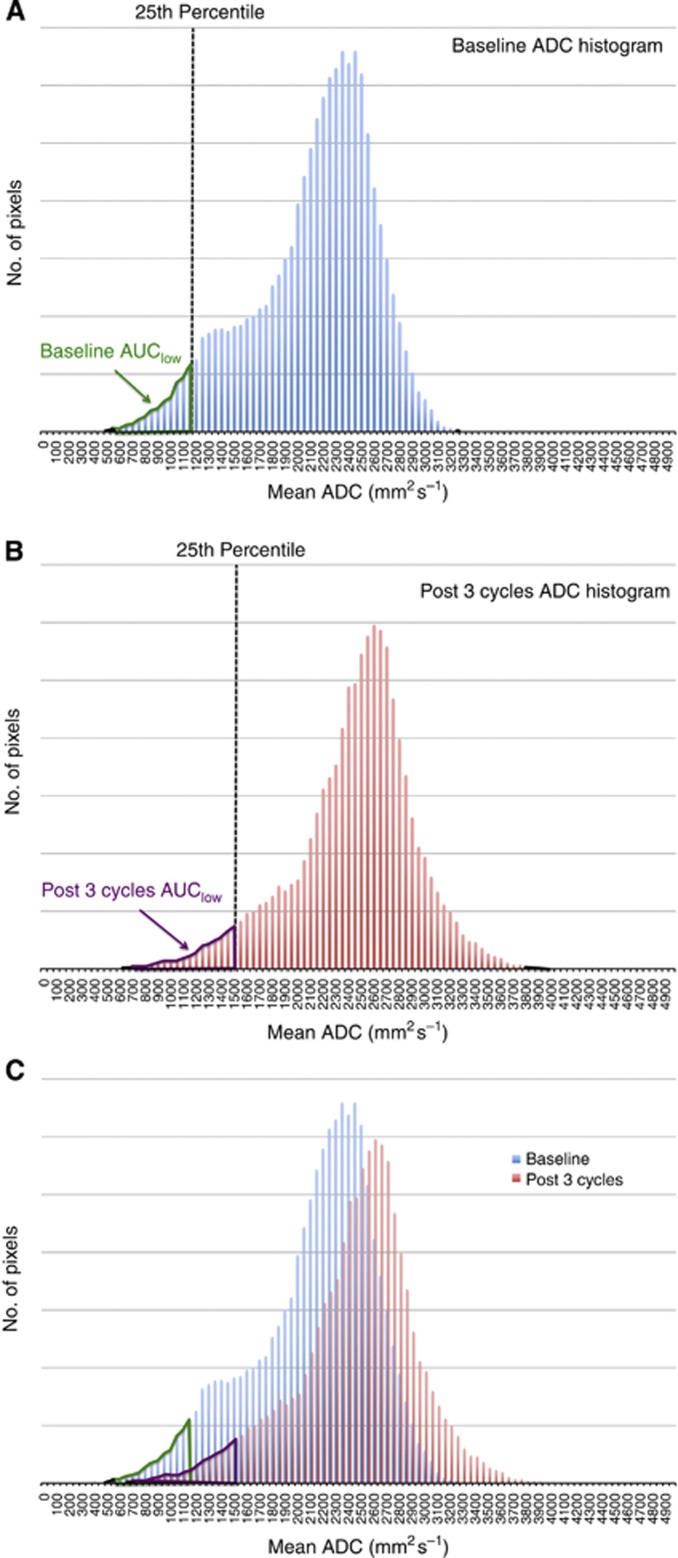
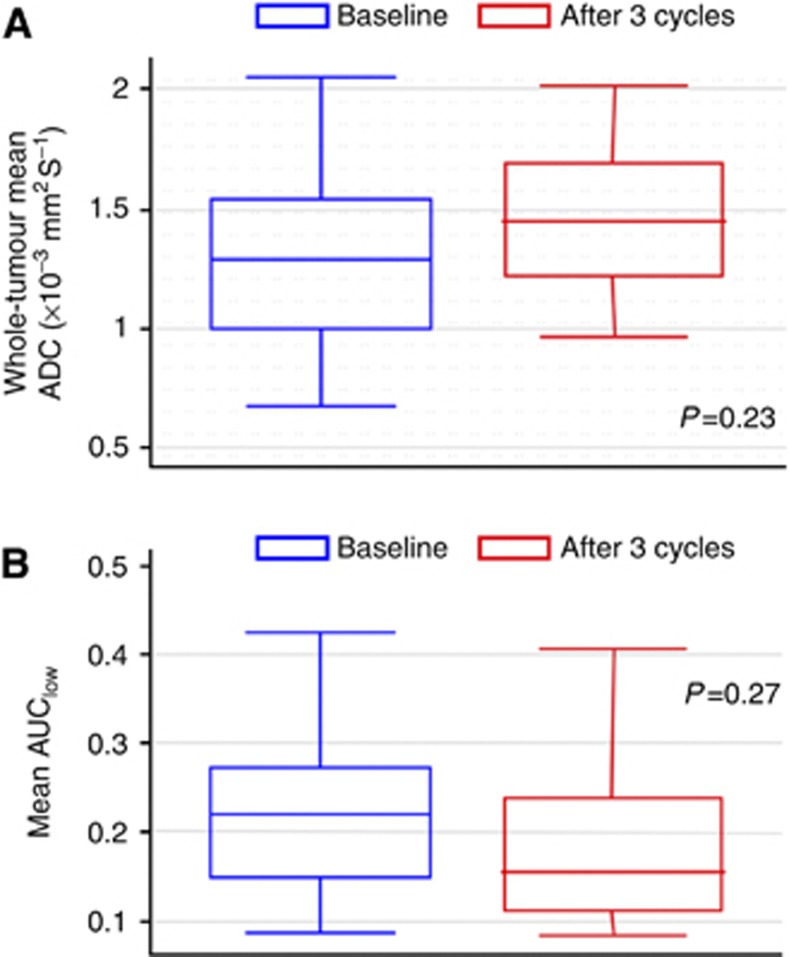
Methods: Treatment-naive mRCC patients on a phase II trial using sunitinib completed an MRI substudy. Whole-tumour apparent diffusion coefficient (ADC) maps and histograms were generated, and mean ADC and AUC(low) (proportion of the tumour with ADC values lying below the 25th percentile of the ADC histogram) recorded. On MCE-MRI, regions of interest were drawn around the most avidly enhancing components to analyse enhancement parameters. Baseline (n=26) and treatment-related changes in surviving patients (n=20) were correlated with OS. Imaged metastases were also analysed.
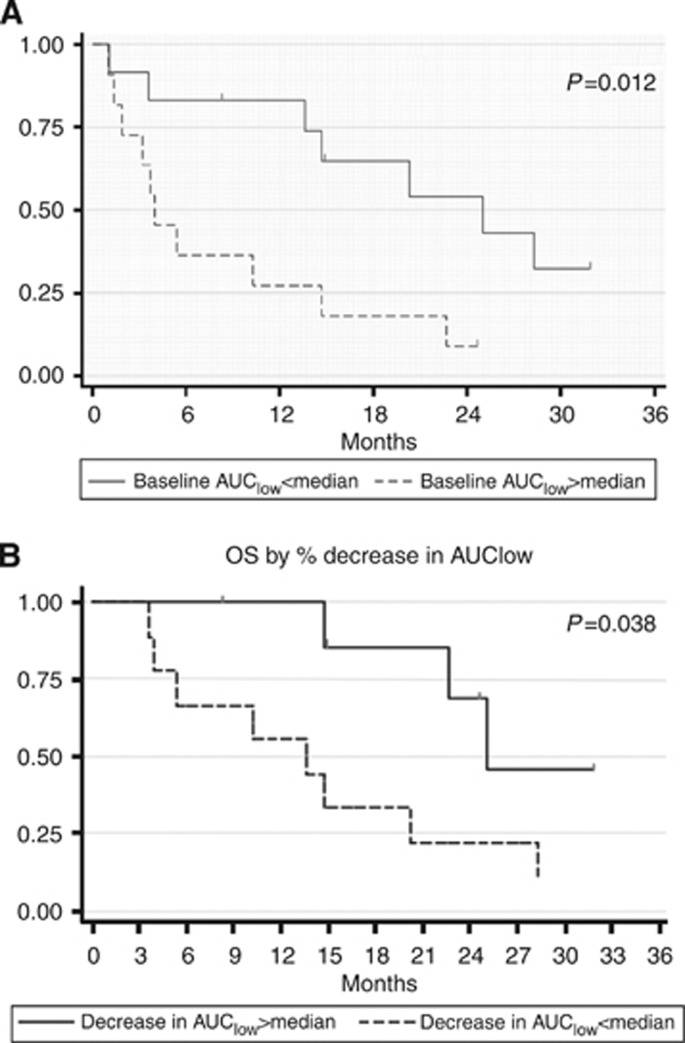
Results: Forty-seven per cent of the patients showed significant changes in whole-tumour mean ADC following therapy, but there was no correlation with outcome. Patients with a high baseline AUC(low) and greater-than-median AUC(low) increase had reduced OS (HR=3.67 (95% confidence interval (CI)=1.23-10.9), P=0.012 and HR=3.72 (95% CI=0.98-14.21), P=0.038, respectively). There was no correlation between MCE-MRI parameters and OS. Twenty-eight metastases were analysed and showed positive correlation with primary tumour mean ADC for individual patients (r=0.607; P<0.001).
Conclusion: Primary RCC ADC histogram analysis shows dynamic changes with sunitinib. Patients in whom the tumour ADC histogram demonstrated high baseline AUC(low) or a greater-than-median increase in AUC(low) with treatment had reduced OS.
Figures
References
-
- Bernardin L, Dilks P, Liyanage S, Miquel ME, Sahdev A, Rockall A. Effectiveness of semi-quantitative multiphase dynamic contrast-enhanced MRI as a predictor of malignancy in complex adnexal masses: radiological and pathological correlation. Eur Radiol. 2012;22:880–890. - PubMed
-
- Desar IM, ter Voert EG, Hambrock T, van Asten JJ, van Spronsen DJ, Mulders PF, Heerschap A, van der Graaf WT, van Laarhoven HW, van Herpen CM. Functional MRI techniques demonstrate early vascular changes in renal cell cancer patients treated with sunitinib: a pilot study. Cancer Imaging. 2011;11:259–265. - PMC - PubMed
-
- Flaherty KT, Rosen MA, Heitjan DF, Gallagher ML, Schwartz B, Schnall MD, O'Dwyer PJ. Pilot study of DCE-MRI to predict progression-free survival with sorafenib therapy in renal cell carcinoma. Cancer Biol Ther. 2008;7:496–501. - PubMed
-
- Gerlinger M, Rowan AJ, Horswell S, Math M, Larkin J, Endesfelder D, Gronroos E, Martinez P, Matthews N, Stewart A, Tarpey P, Varela I, Phillimore B, Begum S, McDonald NQ, Butler A, Jones D, Raine K, Latimer C, Santos CR, Nohadani M, Eklund AC, Spencer-Dene B, Clark G, Pickering L, Stamp G, Gore M, Szallasi Z, Downward J, Futreal PA, Swanton C. Intratumor heterogeneity and branched evolution revealed by multiregion sequencing. N Engl J Med. 2012;366:883–892. - PMC - PubMed
-
- Goh V, Ganeshan B, Nathan P, Juttla JK, Vinayan A, Miles KA. Assessment of response to tyrosine kinase inhibitors in metastatic renal cell cancer: CT texture as a predictive biomarker. Radiology. 2011;261:165–171. - PubMed
Publication types
MeSH terms
Substances
LinkOut - more resources
Full Text Sources
Other Literature Sources
