

Global, regional and national sodium intakes in 1990 and 2010: a systematic analysis of 24 h urinary sodium excretion and dietary surveys worldwide
- PMID: 24366578
- PMCID: PMC3884590
- DOI: 10.1136/bmjopen-2013-003733
Global, regional and national sodium intakes in 1990 and 2010: a systematic analysis of 24 h urinary sodium excretion and dietary surveys worldwide
Abstract
Objectives: To estimate global, regional (21 regions) and national (187 countries) sodium intakes in adults in 1990 and 2010.
Design: Bayesian hierarchical modelling using all identifiable primary sources.
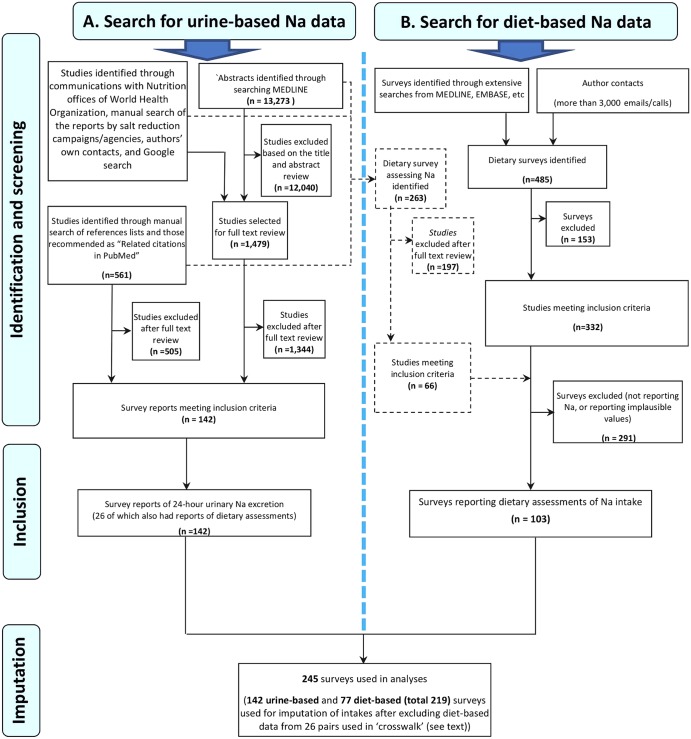
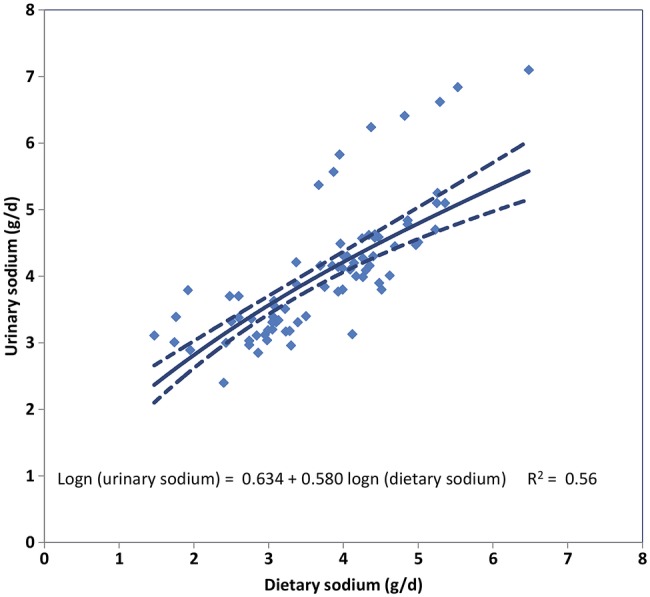
Data sources and eligibility: We searched and obtained published and unpublished data from 142 surveys of 24 h urinary sodium and 103 of dietary sodium conducted between 1980 and 2010 across 66 countries. Dietary estimates were converted to urine equivalents based on 79 pairs of dual measurements.
Modelling methods: Bayesian hierarchical modelling used survey data and their characteristics to estimate mean sodium intake, by sex, 5 years age group and associated uncertainty for persons aged 20+ in 187 countries in 1990 and 2010. Country-level covariates were national income/person and composition of food supplies.
Main outcome measures: Mean sodium intake (g/day) as estimable by 24 h urine collections, without adjustment for non-urinary losses.
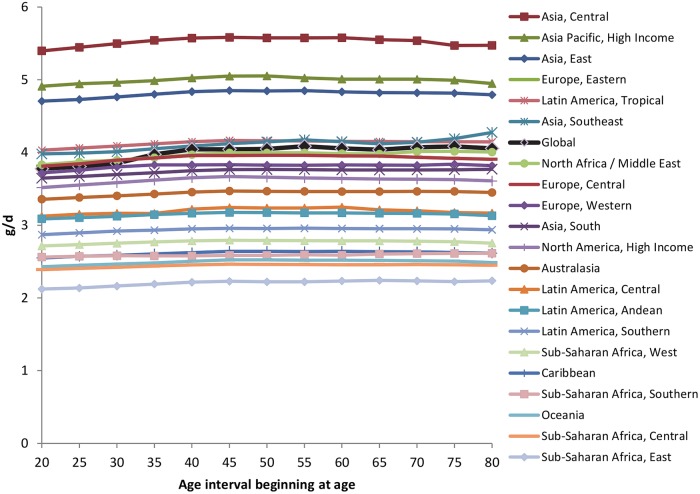
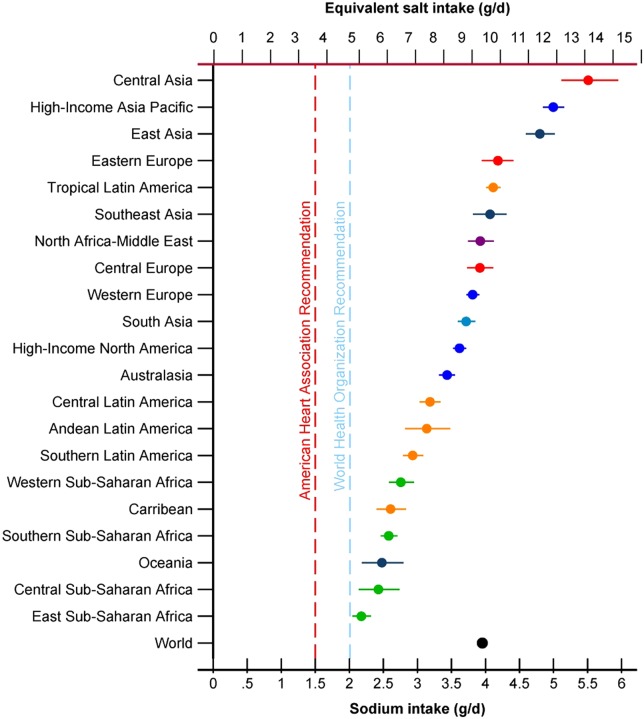
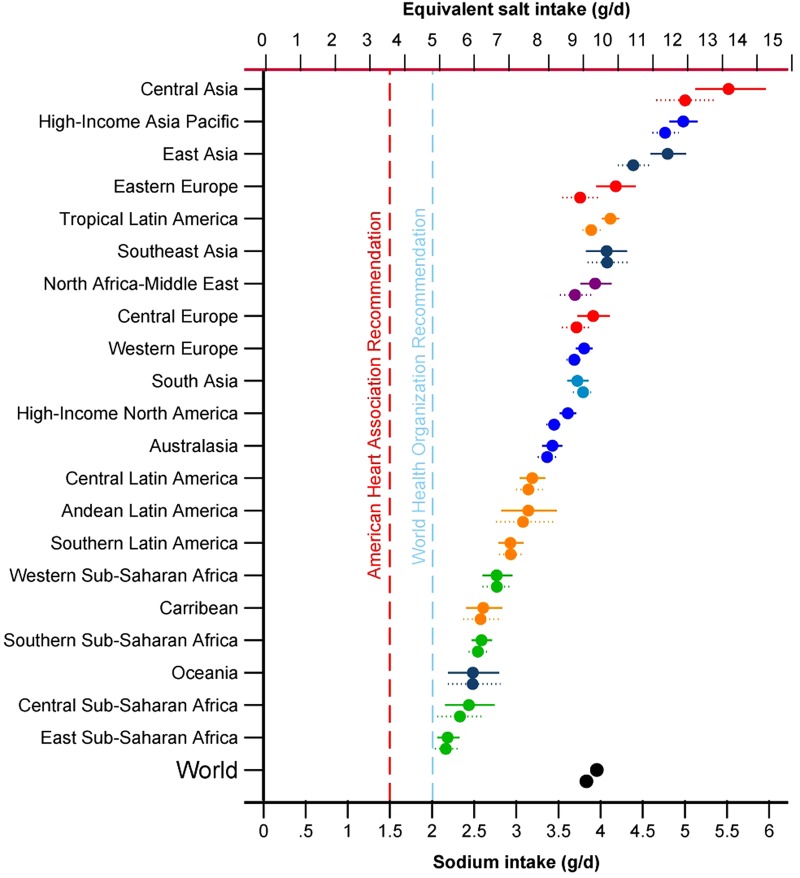
Results: In 2010, global mean sodium intake was 3.95 g/day (95% uncertainty interval: 3.89 to 4.01). This was nearly twice the WHO recommended limit of 2 g/day and equivalent to 10.06 (9.88-10.21) g/day of salt. Intake in men was ∼10% higher than in women; differences by age were small. Intakes were highest in East Asia, Central Asia and Eastern Europe (mean >4.2 g/day) and in Central Europe and Middle East/North Africa (3.9-4.2 g/day). Regional mean intakes in North America, Western Europe and Australia/New Zealand ranged from 3.4 to 3.8 g/day. Intakes were lower (<3.3 g/day), but more uncertain, in sub-Saharan Africa and Latin America. Between 1990 and 2010, modest, but uncertain, increases in sodium intakes were identified.
Conclusions: Sodium intakes exceed the recommended levels in almost all countries with small differences by age and sex. Virtually all populations would benefit from sodium reduction, supported by enhanced surveillance.
Keywords: Epidemiology; Hypertension < Cardiology; Nutrition & Dietetics; Preventive Medicine.
Figures

References
-
- Sacks FM, Svetkey LP, Vollmer WM, et al. Effects on blood pressure of reduced dietary sodium and the Dietary Approaches to Stop Hypertension (DASH) diet. DASH-Sodium Collaborative Research Group. N Engl J Med 2001;344:3–10 - PubMed
-
- He FJ, Li J, MacGregor GA. Effect of longer term modest salt reduction on blood pressure: Cochrane systematic review and meta-analysis of randomised trials. BMJ 2013;346:f1325. - PubMed
-
- Ferlay J, Shin HR, Bray F, et al. Estimates of worldwide burden of cancer in 2008: GLOBOCAN 2008. Int J Cancer 2010;127: 2893–917 - PubMed
Grants and funding
LinkOut - more resources
Full Text Sources
Other Literature Sources
Medical