. 2014 May;134(5):1285-1294.
doi: 10.1038/jid.2013.540. Epub 2013 Dec 23.

A quantitative increase in regulatory T cells controls development of vitiligo

Affiliations

A quantitative increase in regulatory T cells controls development of vitiligo

Shilpak Chatterjee et al. J Invest Dermatol. 2014 May.

Abstract

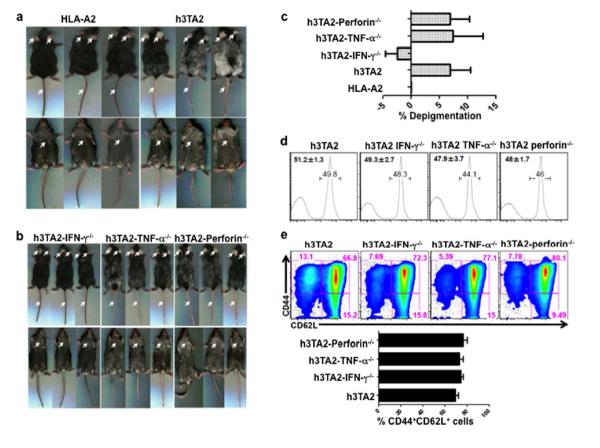
T-cell cytolytic activity targeting epidermal melanocytes is shown to cause progressive depigmentation and autoimmune vitiligo. By using the recently developed transgenic mice h3TA2 that carry T cells with a HLA-A2-restricted human tyrosinase peptide (h-Tyr)-reactive TCR and develop spontaneous vitiligo from an early age, we addressed the mechanism regulating autoimmune vitiligo. Depigmentation was significantly impaired only in IFN-γ-knockout h3TA2 mice but not in TNF-α- or perforin-knockout h3TA2 mouse strains, confirming a central role for IFN-γ in vitiligo development. In addition, regulatory T cells (Tregs) were relatively abundant in h3TA2-IFN-γ(-/-) mice, and depletion of the Treg-engaging anti-CD25 antibody fully restored the depigmentation phenotype in h3TA2-IFN-γ(-/-) mice, mediated in part through the upregulation of proinflammatory cytokines such as IL-17 and IL-22. Further therapeutic potential of Treg abundance in preventing progressive depigmentation was evaluated by adoptively transferring purified Treg or using rapamycin. Both the adoptive transfer of Tregs and the use of rapamycin induced a lasting remission of vitiligo in mice treated at the onset of disease, or in mice with established disease. This leads us to conclude that reduced regulatory responses are pivotal to the development of vitiligo in disease-prone mice, and that a quantitative increase in the Treg population may be therapeutic for vitiligo patients with active disease.


Figures

Figure 1
Figure 1. Development of Vitiligo in h3TA2 mice depends on IFN-γ
(a) Degree of spontaneous depigmentation is shown in three representative age matched h3TA2 (8 weeks) and wild type (HLA-A2). Upper panel shows dorsal scans whereas the lower panels are ventral scan of respective mice. (b) A comparative picture showing the development of vitiligo in 8-weekh3TA2-IFN-γ−/−, h3TA2-TNF-α−/−or h3TA2Perforin−/−. (c) Percentage of depigmentation was calculated from five HLA-A2, h3TA2, h3TA2-IFN-γ−/−, h3TA2-TNF-α−/− and h3TA2-Perforin−/− mice. *p<0.05. Results are shown as mean of percent depigmentation ±SD. (d) Splenocytes (n=4) from either 8 week h3TA2 or h3TA2-IFN-γ−/−, h3TA2-TNF-α−/− and h3TA2-Perforin−/− mice were stained using TCR specific human Vβ12 antibody to determine the abundance of transgenic T cells, and (e) fluorochrome conjugated CD44 and CD62L.
Figure 2
Figure 2. Development of vitiligo in h3TA2 mice is independent of CCR5 or CXCR3
(a). Comparative pictures for the development of vitiligo among age matched (8 weeks) h3TA2, h3TA2-CXCR3−/− or h3TA2-CCR5−/− mice. Lower panel shows the quantification for percent depigmentation between the groups on top. Results are shown as mean of percent depigmentation ±SD.(b) Transgenic T cells (2×10⁵) from various h3TA2 strains were TCR stimulated overnight with cognate epitope (human Tyrosinase) and control epitope (MART-1). Supernatant was then evaluated for IFN-γ secretion using ELISA. (c) Splenic or peripheral blood transgenic T cells (2×10⁵) from h3TA2 mice were either TCR stimulated or with PMA/ionomycin (500ng/ml) and stained for intracellular cytokine IFN-γ and IL-17.
Figure 3
Figure 3. IFN-γ deficiency increases Treg and effector T cells to Treg ratio
(a) Splenocytes from age matched h3TA2 or h3TA2-IFN-γ−/− mice were stained with fluorochrome-conjugated antibodies against hVβ12, mCD4, mCD8 or mCD25 antibodies followed byFoxP3 intracellular staining. Representative data from one of three experiments is shown. (b) Bar diagram representing total number of Treg (CD4+CD25+FoxP3+) cells. Data represent mean ±SD of three independent experiments. **p<0.01. (c) Bar representation of the T effector (Vβ12+CD4CD8) vs. Treg (CD4+CD25+FoxP3+) ratio for h3TA2 or h3TA2-IFN-γ−/− mice. Data represents mean ±SD of three independent experiments. **p<0.01. (d) Splenocytes fromh3TA2-IFN-γ−/−(n=3) mice injected with anti-CD25 antibody were evaluated for Treg population by staining for CD4, CD25 and FoxP3.(e) h3TA2-IFN-γ−/− mice injected i.p weekly with anti-CD25 antibody (500μg/mouse) from 3 to 15 weeks of age and assessed for vitiligo development.(f) Splenocytes obtained from (e) were TCR stimulated with cognate peptide (human Tyrosinase) and control peptide (MART-1). Supernatant was then evaluated for IL-17 and IL-22 secretion using ELISA. (g) Skin sections were prepared from (e) and stained for CD3 and IL-17α. Arrows: green, CD3; red, IL-17α; orange, merged CD3, IL-17a and DAPI. Scale bar is equal to 94 μm. Right panel showing total number of CD3+IL-17α+ T cells present per millimeter (mm)2 areas of the skin sample were counted and presented graphically.(h) Supernatant obtained in (f) were evaluated using multiplex for different cytokines and chemokines as indicated.*p<0.05, **p<0.01, ***p<0.0001.
Figure 4
Figure 4. Transfer of Treg controls the development of vitiligo in h3TA2 mice
(a) Sorting strategy of Treg from FoxP3-EGFP-A2 mice used for the adoptive transfer to h3TA2 mice. (b) Representative pictures of h3TA2 mice after 6 weeks post Treg transfer (2×10⁵cells/animal) are shown. Percentage of depigmentation was assessed and represented by bar diagram. (c) Six weeks after Treg transfer splenocytes were stained for mCD4, mCD8 or mCD25 and FoxP3. Bar diagrams represent Treg quantification from either untreated or Treg treated h3TA2 mice. Data represent mean ±SD of five independent experiments. **p<0.01. (d) Transgenic T cells were quantified by staining splenocytes from untreated or post-Treg treated mice with anti-human Vβ12 antibody. (e) Representation of T effector (Vβ12+CD4CD8) vs. Treg (CD4+CD25+FoxP3+) ratio in h3TA2 untreated and treated with HLA-A2+Treg. Data represent mean ±SD of five independent experiments. **p<0.01.
Figure 5
Figure 5. Functionality of transgenic T cells remains unaffected in Treg transferred group
(a) Splenocytes from either untreated or 6 weeks post Treg transferred h3TA2 mice were stimulated overnight in presence of different concentration of h-Tyr. Cells were then stained with anti-human Vβ12 followed by intracellular staining for cytokines mIFN-γ, mTNF-α, IL-17 and IL-10. (b) Immunofluorescence staining of skin samples obtained from either untreated h3TA2 (n=3) or 6 weeks post Treg transferred h3TA2 mice (n=3). FoxP3+T cells were detected in the skin samples by using fluorochrome conjugated anti CD3 and anti FoxP3 antibody. Arrows: green, CD3; red, FoxP3; orange, merged CD3, FoxP3 and DAPI. Scale bar is equal to 21μm. Right panel showing total number of CD3+FoxP3+Treg present per millimeter (mm)2 areas of the skin sample were counted and presented graphically.

References

    1. Akashi S, Sho M, Kashizuka H, et al. A novel small-molecule compound targeting CCR5 and CXCR3 prevents acute and chronic allograft rejection. Transplantation. 2005;80:378–84. - PubMed
    1. Baecher-Allan C, Hafler DA. Human regulatory T cells and their role in autoimmune disease. Immunol Rev. 2006;212:203–16. - PubMed
    1. Bagasra O. Protocols for the in situ PCR-amplification and detection of mRNA and DNA sequences. Nat Protoc. 2007;2:2782–95. - PubMed
    1. Bailey-Bucktrout SL, Bluestone JA. Regulatory T cells: stability revisited. Trends Immunol. 2011;32:301–6. - PMC - PubMed
    1. Bassiouny DA, Shaker O. Role of interleukin-17 in the pathogenesis of vitiligo. Clin Exp Dermatol. 2011;36:292–7. - PubMed

Publication types

MeSH terms