

Widening rural-urban disparities in all-cause mortality and mortality from major causes of death in the USA, 1969-2009
- PMID: 24366854
- PMCID: PMC3978153
- DOI: 10.1007/s11524-013-9847-2
Widening rural-urban disparities in all-cause mortality and mortality from major causes of death in the USA, 1969-2009
Abstract
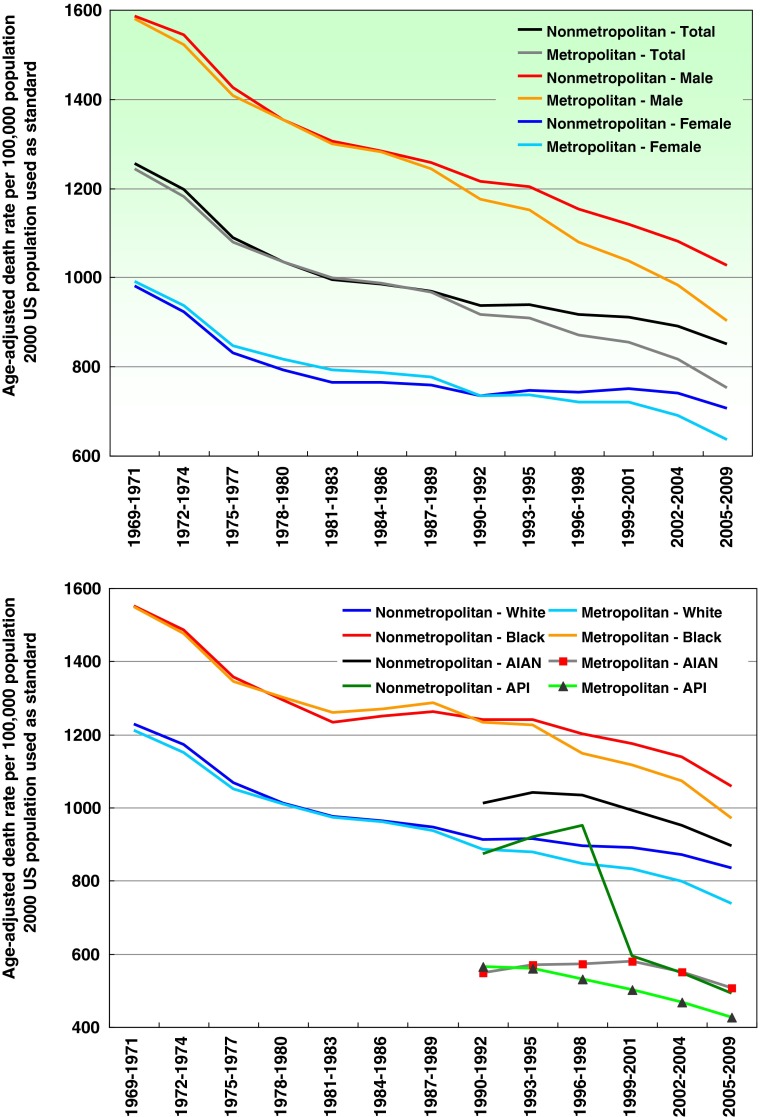
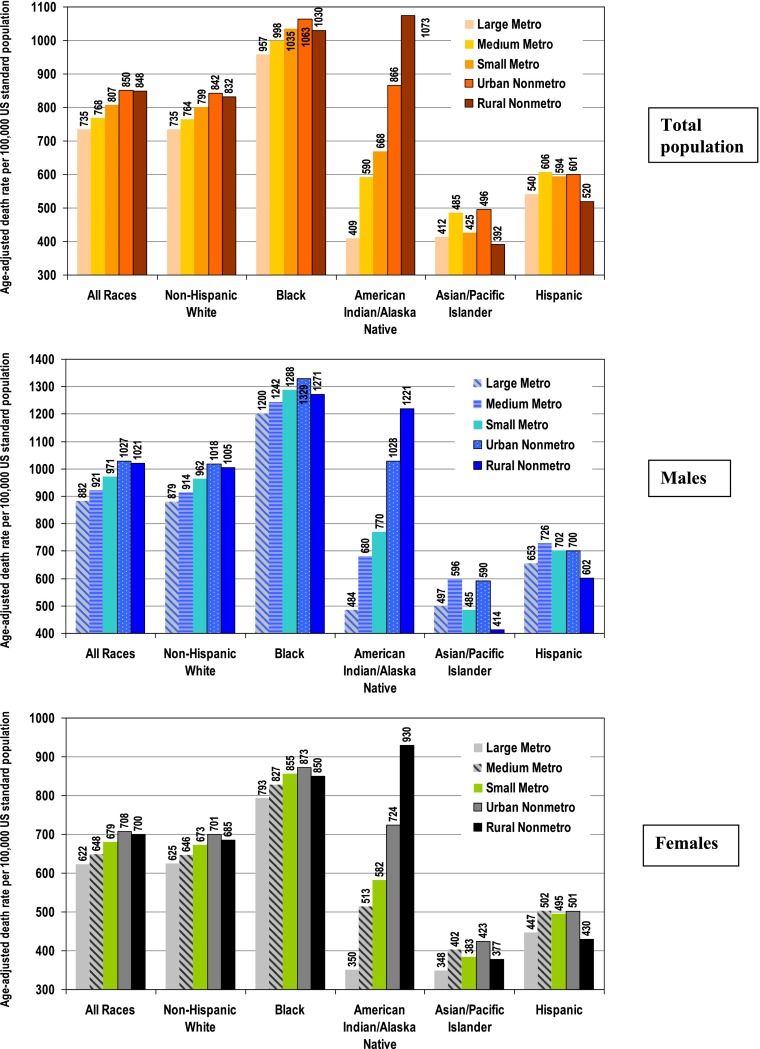
This study examined trends in rural-urban disparities in all-cause and cause-specific mortality in the USA between 1969 and 2009. A rural-urban continuum measure was linked to county-level mortality data. Age-adjusted death rates were calculated by sex, race, cause-of-death, area-poverty, and urbanization level for 13 time periods between 1969 and 2009. Cause-of-death decomposition and log-linear and Poisson regression were used to analyze rural-urban differentials. Mortality rates increased with increasing levels of rurality overall and for non-Hispanic whites, blacks, and American Indians/Alaska Natives. Despite the declining mortality trends, mortality risks for both males and females and for blacks and whites have been increasingly higher in non-metropolitan than metropolitan areas, particularly since 1990. In 2005-2009, mortality rates varied from 391.9 per 100,000 population for Asians/Pacific Islanders in rural areas to 1,063.2 for blacks in small-urban towns. Poverty gradients were steeper in rural areas, which maintained higher mortality than urban areas after adjustment for poverty level. Poor blacks in non-metropolitan areas experienced two to three times higher all-cause and premature mortality risks than affluent blacks and whites in metropolitan areas. Disparities widened over time; excess mortality from all causes combined and from several major causes of death in non-metropolitan areas was greater in 2005-2009 than in 1990-1992. Causes of death contributing most to the increasing rural-urban disparity and higher rural mortality include heart disease, unintentional injuries, COPD, lung cancer, stroke, suicide, diabetes, nephritis, pneumonia/influenza, cirrhosis, and Alzheimer's disease. Residents in metropolitan areas experienced larger mortality reductions during the past four decades than non-metropolitan residents, contributing to the widening gap.
Figures
References
-
- Health, United States, 2010 with special feature on death and dying. Hyattsville: US Department of Health and Human Services; 2011. - PubMed
-
- Vital statistics of the United States 1950, volume I. Washington, DC: US Government Printing Office; 1954.
-
- Grove RD, Hetzel AM. Vital statistics rates in the United States, 1940–1960. National Center for Health Statistics. Washington, DC: US Government Printing Office; 1968.
-
- Kitagawa EM, Hauser PM. Differential mortality in the United States: a study in socioeconomic epidemiology. Cambridge, UK: Harvard University Press; 1973.
Publication types
MeSH terms
LinkOut - more resources
Full Text Sources
Other Literature Sources
Medical
Miscellaneous
