. 2014 Feb 14;289(7):4532-45.
doi: 10.1074/jbc.M113.502690. Epub 2013 Dec 23.

Analysis of the hippocampal proteome in ME7 prion disease reveals a predominant astrocytic signature and highlights the brain-restricted production of clusterin in chronic neurodegeneration

Affiliations

Analysis of the hippocampal proteome in ME7 prion disease reveals a predominant astrocytic signature and highlights the brain-restricted production of clusterin in chronic neurodegeneration

Ayodeji A Asuni et al. J Biol Chem. .

Abstract

Prion diseases are characterized by accumulation of misfolded protein, gliosis, synaptic dysfunction, and ultimately neuronal loss. This sequence, mirroring key features of Alzheimer disease, is modeled well in ME7 prion disease. We used iTRAQ(TM)/mass spectrometry to compare the hippocampal proteome in control and late-stage ME7 animals. The observed changes associated with reactive glia highlighted some specific proteins that dominate the proteome in late-stage disease. Four of the up-regulated proteins (GFAP, high affinity glutamate transporter (EAAT-2), apo-J (Clusterin), and peroxiredoxin-6) are selectively expressed in astrocytes, but astrocyte proliferation does not contribute to their up-regulation. The known functional role of these proteins suggests this response acts against protein misfolding, excitotoxicity, and neurotoxic reactive oxygen species. A recent convergence of genome-wide association studies and the peripheral measurement of circulating levels of acute phase proteins have focused attention on Clusterin as a modifier of late-stage Alzheimer disease and a biomarker for advanced neurodegeneration. Since ME7 animals allow independent measurement of acute phase proteins in the brain and circulation, we extended our investigation to address whether changes in the brain proteome are detectable in blood. We found no difference in the circulating levels of Clusterin in late-stage prion disease when animals will show behavioral decline, accumulation of misfolded protein, and dramatic synaptic and neuronal loss. This does not preclude an important role of Clusterin in late-stage disease, but it cautions against the assumption that brain levels provide a surrogate peripheral measure for the progression of brain degeneration.

Keywords: Astrocytes; ME7; Mass Spectrometry (MS); Neurobiology; Neurodegeneration; Prion; Prions; iTRAQ; mRNA.


Figures

FIGURE 1.
FIGURE 1.
Basic synaptic architecture in the ME7 model. Representative immunohistological staining using 6H4 PrP monoclonal antibody on autoclaved formic acid-treated coronal sections from NBH control animals (A) are compared with ME7 animals (B, showing accumulated misfolded prion (PrPSc; brown stain)). Synaptophysin monoclonal antibody (mAb SY38) staining of normal hippocampal strata in NBH animals (C) are compared with ME7 animals (D, showing synaptic disorganization and neurodegeneration in late stage prion hippocampal tissue). Labeling of hippocampal layers is as follows: Or, oriens layer; Rad, stratum radiatum; LMol, lacunosum molecular layer; MoDG, molecular layer dentate gyrus; GrDG, granular layer dentate gyrus; PoDG, polymorph layer dentate gyrus. Scale bar, 200 μm. E shows a representative Western blot of total brain homogenates from normal (NBH) or ME7-inoculated mice showing disease-associated increase of PrP (mAb 6H4) and a decrease in synaptic marker protein synaptophysin (mAb SY38) in ME7 compared with NBH animals.
FIGURE 2.
FIGURE 2.
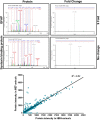
Representative MS/MS spectra for two peptides identified in this analysis are shown. Top and middle panels, 100 μg of homogenate was denatured, reduced/alkylated, trypsin-digested, and labeled with iTRAQ reagents 115.1 and 117.1 in parallel. Both reagents have a reporter group to label primary amines as well as a balance arm. The resulting labeled, complex peptide mixture was mixed and separated by cation exchange chromatography. Following collision-induced dissociation MS/MS analysis of the precursor ion, the reporter groups appear as distinct ions (m/z 115–117), and the relative concentration of the peptides is derived from the relative intensities of the reporter ions. MS/MS spectra for Syntaxin-binding protein and GFAP are shown, with the peptide fragmentation and isobaric tag fragmentation that are used to identify (left panel) and quantify (right panel) protein expression, respectively. All signals with reporter ion intensity of <20 were ignored. This analysis produced robust signals encompassing 2–9 peptides from >200 individual hippocampal proteins. Correlogram showing relative expression of over 200 hippocampal proteins in NBH and ME7 hippocampal extracts. Bottom panel, over 200 proteins were predicted using bioinformatics tools. We used a 2-fold change as a cutoff to score changes in protein expression; eight proteins were identified as up-regulated and three proteins as down-regulated in ME7 compared with NBH animals. Four of the up-regulated proteins (GFAP, Clusterin, EAAT-2, and Prdx6) are components of astrocyte.
FIGURE 3.
FIGURE 3.
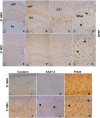
Reactive astrocytes in the hippocampus of ME7 animals. Photomicrographs illustrate GFAP expression in NBH and ME7 animals at 21 weeks. Nuclei were counterstained with hematoxylin. GFAP immunoreactivity in astrocytes in the hippocampal layers of NBH animals (see arrowheads in A–D, ×5, ×10, ×20, and ×40 magnifications, respectively) is shown. At this stage, there is minimal GFAP staining in the cortical regions of NBH animals (data not shown). ME7 animals were strongly positive for GFAP, particularly within the swollen astrocytic processes (see arrowheads in E–H, ×5, ×10, ×20, and ×40 magnifications, respectively), and at this stage of the disease, there is strong GFAP staining in the cortex (data not shown). Labeling of hippocampal areas: hippocampal formation (HPF); dentate gyrus (DG); posterior thalamic nucleus (Po); cornu ammonis area 1 (CA1); stratum radiatum (SRad). Brain sections were stained with antibodies against the other astrocyte-associated proteins highlighted in the proteomic analysis, and representative images are shown of the stratum radiatum in NBH and ME7 animals immunostained for Clusterin (I and J), EAAT-2 (K and L), and Prdx6 (M and N) (arrowheads are directed to examples of immunoreactive astrocytes). Scale bar, 20 μm.
FIGURE 4.
FIGURE 4.
Prdx6 staining of hippocampus in NBH and ME7 animals. Representative fluorescent images to illustrate Prdx6 expression in astrocytes in the CA1 hippocampal region of NBH and ME7 animals. A–D, co-staining of Prdx6 with GFAP in NBH animals. A, GFAP, Texas red; B, nuclei, DAPI blue; C, Prdx6, FITC green; and D, merged image. Scale bar, 100 μm. E–H, ME7 animals. E, Prdx6, FITC green; F, nuclei, DAPI blue; G, GFAP, Texas red; and H, merged image. Scale bar, 75 μm. I, representative image showing CA1 hippocampal region of high expression coincidence of Prdx6 and GFAP (arrowheads) in ME7 animals are shown at a higher magnification. ImageJ co-localization is shown in white in the far right, illustrating the pixels having both significant red and green signal (J). Scale bar, 50 μm.
FIGURE 5.
FIGURE 5.
Expression of the proliferation marker Ki67 in the hippocampus of ME7 animals and its co-localization with astrocyte marker GFAP. Representative images are from coronal sections showing hippocampal region stratum radiatum (SRad) (A) and dentate gyrus (DG) of ME7 animals stained for Ki67+ cells, FITC green and GFAP, Texas red (B). Majority of Ki67 staining (FITC green) was restricted to the nucleus (arrowheads) and largely distinct from the GFAP (Texas red). A few Ki67+ cells were apposed to GFAP (arrows), but this was associated with rather than within the GFAP-positive cells. Scale bar, 100 μm.
FIGURE 6.
FIGURE 6.
Western blot analysis to verify the protein changes observed from MS analysis. Quantitative Western blotting of astrocytic proteins in hippocampal homogenates (brain equivalent, 20 μg) from normal animals (pooled NBH controls) compared with ME7 animals (13 and 21 weeks) Samples were probed for the presence of PrP (mAb 6H4) and candidate up-regulated proteins (GFAP, EAAT-2, Clusterin, and Prdx6). A–E shows representative experimental blots. 1st lanes, NBH control; 2nd lanes, 13-week ME7; and 3rd lanes, 21-week ME7. F–J, densitometric data in each bar represents means ± S.E. from n = 5 animals. The error bar represents direct comparison between the protein expression in NBH control samples and the ME7 animals. * signifies p < 0.05; ** signifies p < 0.01; *** signifies p < 0.001.
FIGURE 7.
FIGURE 7.
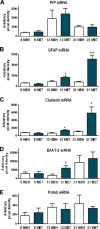
TaqMan RT-PCR. TaqMan RT-PCR analysis of EAAT-2, Prdx6, PrP, GFAP, and Clusterin mRNAs in NBH is compared with ME7 animals. A, PrP mRNA appears unchanged, although the levels were higher at the mid-stage of the disease. B and C, Clusterin and GFAP transcription were increased ∼5-fold (*, p < 0.05; ***, p < 0.001, respectively), compared with NBH at the late stage of the disease. D, there was no difference in the levels of EAAT-2 transcript at the late stage of the disease, although there was a significant increase in EAAT-2 mRNA at the mid-stage of disease, compared with NBH. E, there was no transcriptional regulation of Prdx6 associated with the disease propagation.
FIGURE 8.
FIGURE 8.
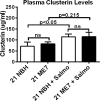
Measurement of Clusterin in serum. The levels of Clusterin were measured by quantitative sandwich ELISA in serum of NBH and ME7 animals with or without systemic S. typhimurium infection. S.E. values are shown, and there were no statistical (ns) differences between NBH and ME7 animals in both groups.

References

    1. Chiesa R., Drisaldi B., Quaglio E., Migheli A., Piccardo P., Ghetti B., Harris D. A. (2000) Accumulation of protease-resistant prion protein (PrP) and apoptosis of cerebellar granule cells in transgenic mice expressing a PrP insertional mutation. Proc. Natl. Acad. Sci. U.S.A. 97, 5574–5579 - PMC - PubMed
    1. Muchowski P. J. (2002) Protein misfolding, amyloid formation, and neurodegeneration: a critical role for molecular chaperones? Neuron 35, 9–12 - PubMed
    1. Morimoto R. I. (2008) Proteotoxic stress and inducible chaperone networks in neurodegenerative disease and aging. Genes Dev. 22, 1427–1438 - PMC - PubMed
    1. Aguzzi A. (2004) Understanding the diversity of prions. Nat. Cell Biol. 6, 290–292 - PubMed
    1. Caughey B., Baron G. S. (2006) Prions and their partners in crime. Nature 443, 803–810 - PubMed

Publication types