

Anthrax lethal toxin inhibits translation of hypoxia-inducible factor 1α and causes decreased tolerance to hypoxic stress
- PMID: 24366872
- PMCID: PMC3924283
- DOI: 10.1074/jbc.M113.530006
Anthrax lethal toxin inhibits translation of hypoxia-inducible factor 1α and causes decreased tolerance to hypoxic stress
Abstract
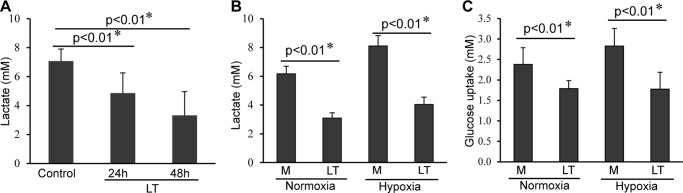
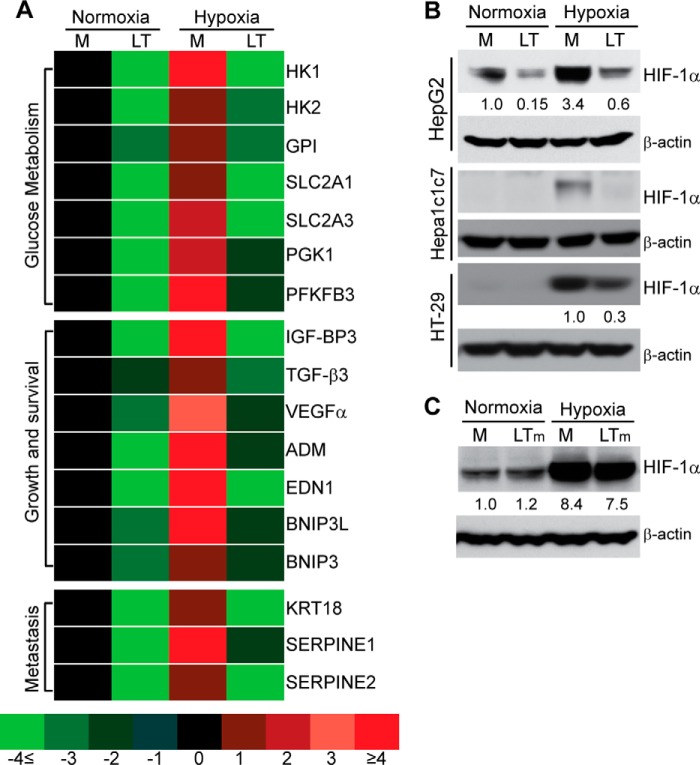
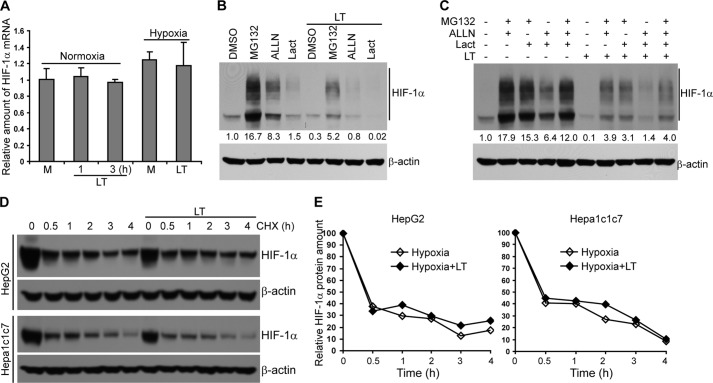
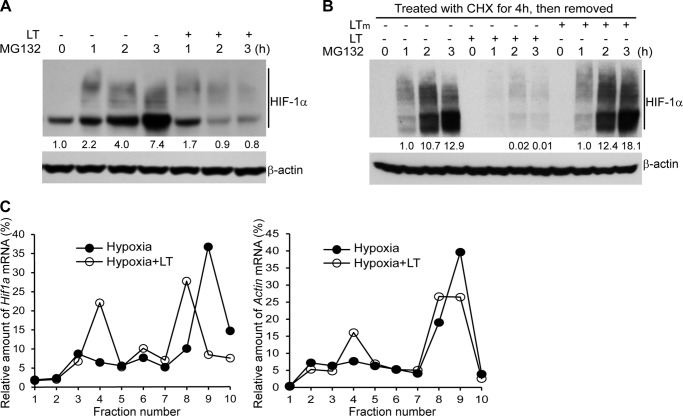
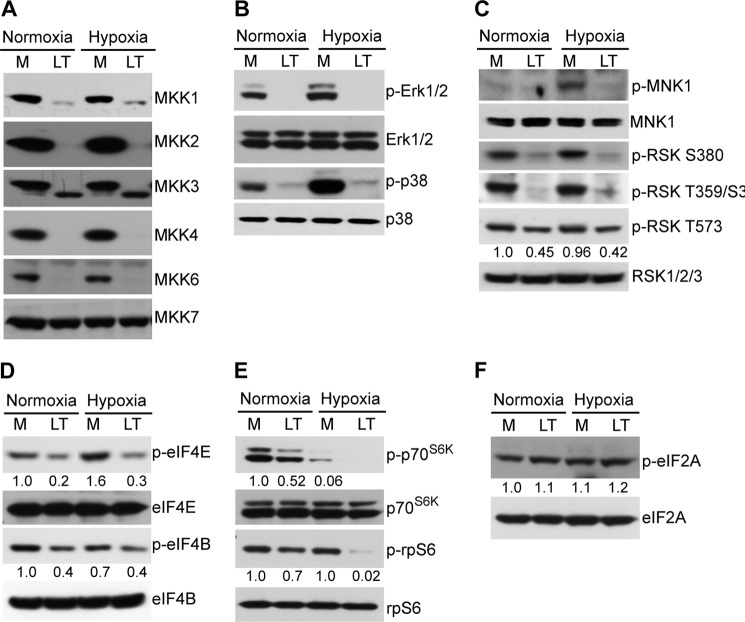
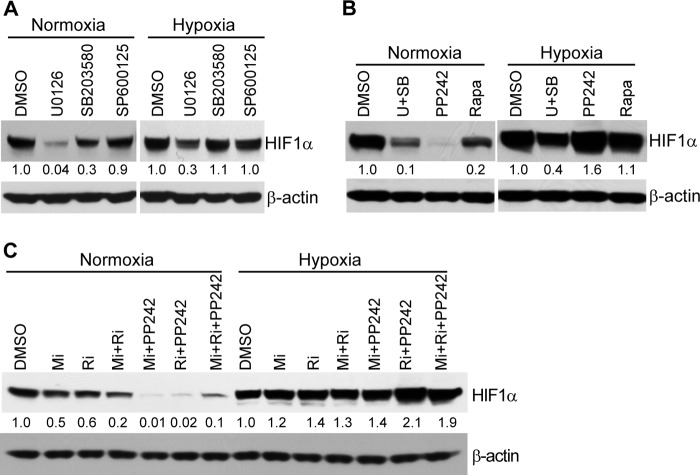
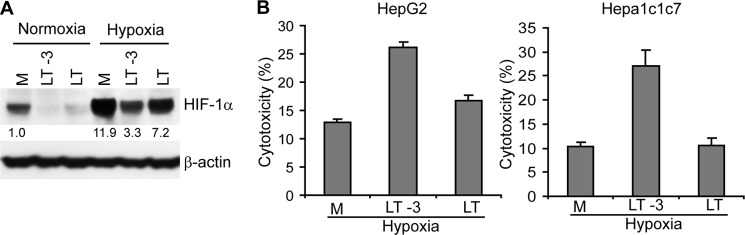
Hypoxia is considered to be a contributor to the pathology associated with administration of anthrax lethal toxin (LT). However, we report here that serum lactate levels in LT-treated mice are reduced, a finding inconsistent with the anaerobic metabolism expected to occur during hypoxia. Reduced lactate levels are also observed in the culture supernatants of LT-treated cells. LT inhibits the accumulation of hypoxia-inducible factor (HIF)-1α, a subunit of HIF-1, the master regulator directing cellular responses to hypoxia. The toxin has no effect on the transcription or protein turnover of HIF-1α, but instead it acts to inhibit HIF-1α translation. LT treatment diminishes phosphorylation of eIF4B, eIF4E, and rpS6, critical components of the intracellular machinery required for HIF-1α translation. Moreover, blockade of MKK1/2-ERK1/2, but not p38 or JNK signaling, lowers HIF-1α protein levels in both normoxic and hypoxic conditions, consistent with a role for MKK1 and MKK2 as the major targets of LT responsible for the inhibition of HIF-1α translation. The physiological importance of the LT-induced translation blockade is demonstrated by the finding that LT treatment decreases the survival of hepatocyte cell lines grown in hypoxic conditions, an effect that is overcome by preinduction of HIF-1α. Taken together, these data support a role for LT in dysregulating HIF-1α and thereby disrupting homeostatic responses to hypoxia, an environmental characteristic of certain tissues at baseline and/or during disseminated infection with Bacillus anthracis.
Keywords: Bacillus; Bacterial Pathogenesis; Hypoxia; Hypoxia-inducible Factor; Infectious Diseases; MAP kinases (MAPKs); Protein Stability; Toxins; Translation; mTOR.
Figures
Similar articles
-
Anthrax lethal toxin rapidly reduces c-Jun levels by inhibiting c-Jun gene transcription and promoting c-Jun protein degradation.J Biol Chem. 2017 Oct 27;292(43):17919-17927. doi: 10.1074/jbc.M117.805648. Epub 2017 Sep 11. J Biol Chem. 2017. PMID: 28893904 Free PMC article.
-
A quassinoid 6alpha-tigloyloxychaparrinone inhibits hypoxia-inducible factor-1 pathway by inhibition of eukaryotic translation initiation factor 4E phosphorylation.Eur J Pharmacol. 2008 Sep 11;592(1-3):41-7. doi: 10.1016/j.ejphar.2008.06.104. Epub 2008 Jul 4. Eur J Pharmacol. 2008. PMID: 18639543
-
Hypoxia-inducible factor-1α (HIF-1α) promotes cap-dependent translation of selective mRNAs through up-regulating initiation factor eIF4E1 in breast cancer cells under hypoxia conditions.J Biol Chem. 2013 Jun 28;288(26):18732-42. doi: 10.1074/jbc.M113.471466. Epub 2013 May 10. J Biol Chem. 2013. PMID: 23667251 Free PMC article.
-
Cellular and systemic effects of anthrax lethal toxin and edema toxin.Mol Aspects Med. 2009 Dec;30(6):439-55. doi: 10.1016/j.mam.2009.07.003. Epub 2009 Jul 26. Mol Aspects Med. 2009. PMID: 19638283 Free PMC article. Review.
-
Anthrax and the inflammasome.Microbes Infect. 2012 May;14(5):392-400. doi: 10.1016/j.micinf.2011.12.005. Epub 2011 Dec 17. Microbes Infect. 2012. PMID: 22207185 Free PMC article. Review.
Cited by
-
Erk1/2 Inactivation-Induced c-Jun Degradation Is Regulated by Protein Phosphatases, UBE2d3, and the C-Terminus of c-Jun.Int J Mol Sci. 2021 Apr 9;22(8):3889. doi: 10.3390/ijms22083889. Int J Mol Sci. 2021. PMID: 33918729 Free PMC article.
-
The Protective Effects of Protease Inhibitor MG-132 on Sepsis-Induced Acute Lung Rats and Its Possible Mechanisms.Med Sci Monit. 2019 Aug 1;25:5690-5699. doi: 10.12659/MSM.915743. Med Sci Monit. 2019. PMID: 31366881 Free PMC article.
-
Hypoxic 3D in vitro culture models reveal distinct resistance processes to TKIs in renal cancer cells.Cell Biosci. 2017 Dec 16;7:71. doi: 10.1186/s13578-017-0197-8. eCollection 2017. Cell Biosci. 2017. PMID: 29270287 Free PMC article.
-
CXCR7 promotes melanoma tumorigenesis via Src kinase signaling.Cell Death Dis. 2019 Feb 25;10(3):191. doi: 10.1038/s41419-019-1442-3. Cell Death Dis. 2019. PMID: 30804329 Free PMC article.
-
Bacterial Virulence Factors: Secreted for Survival.Indian J Microbiol. 2017 Mar;57(1):1-10. doi: 10.1007/s12088-016-0625-1. Epub 2016 Nov 5. Indian J Microbiol. 2017. PMID: 28148975 Free PMC article. Review.
References
-
- Mock M., Fouet A. (2001) Anthrax. Annu. Rev. Microbiol. 55, 647–671 - PubMed
-
- Bhatnagar R., Batra S. (2001) Anthrax toxin. Crit. Rev. Microbiol. 27, 167–200 - PubMed
-
- Turk B. E. (2007) Manipulation of host signalling pathways by anthrax toxins. Biochem. J. 402, 405–417 - PubMed
-
- Bromberg-White J. L., Duesbery N. S. (2008) Biological and biochemical characterization of anthrax lethal factor, a proteolytic inhibitor of MEK signaling pathways. Methods Enzymol. 438, 355–365 - PubMed
Publication types
MeSH terms
Substances
LinkOut - more resources
Full Text Sources
Other Literature Sources
Medical
Research Materials
Miscellaneous
