. 2014 Mar;42(5):2848-55.
doi: 10.1093/nar/gkt1353. Epub 2013 Dec 23.

Models that include supercoiling of topological domains reproduce several known features of interphase chromosomes

Affiliations

Models that include supercoiling of topological domains reproduce several known features of interphase chromosomes

Fabrizio Benedetti et al. Nucleic Acids Res. 2014 Mar.

Abstract

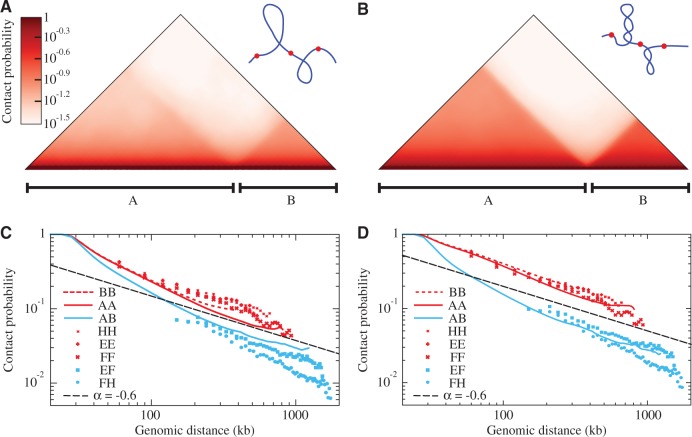
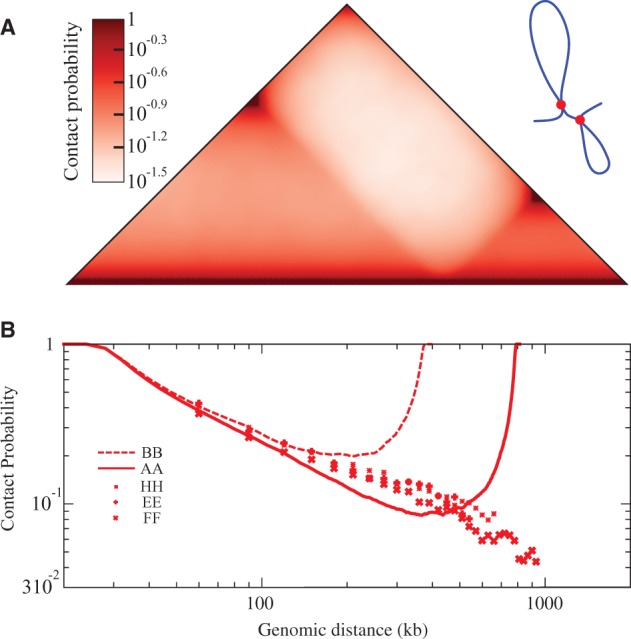
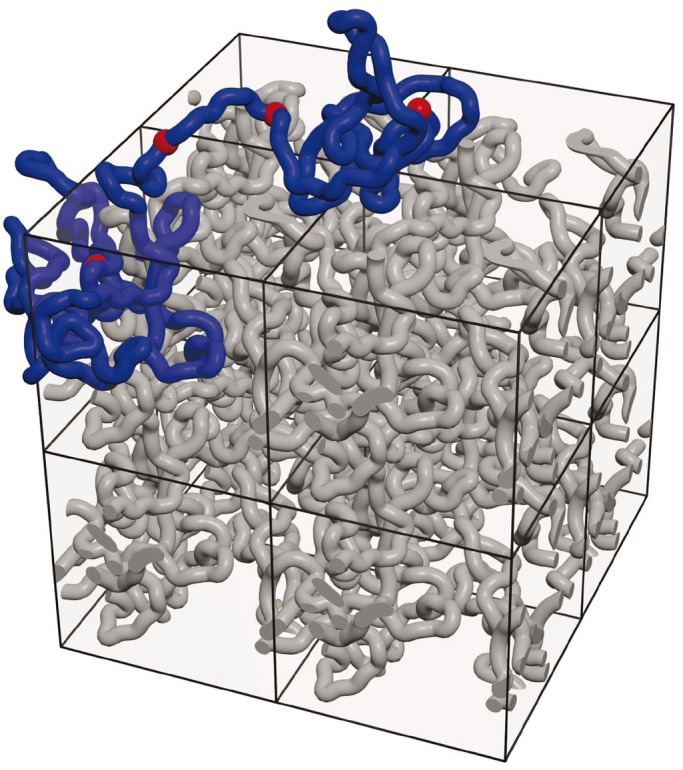
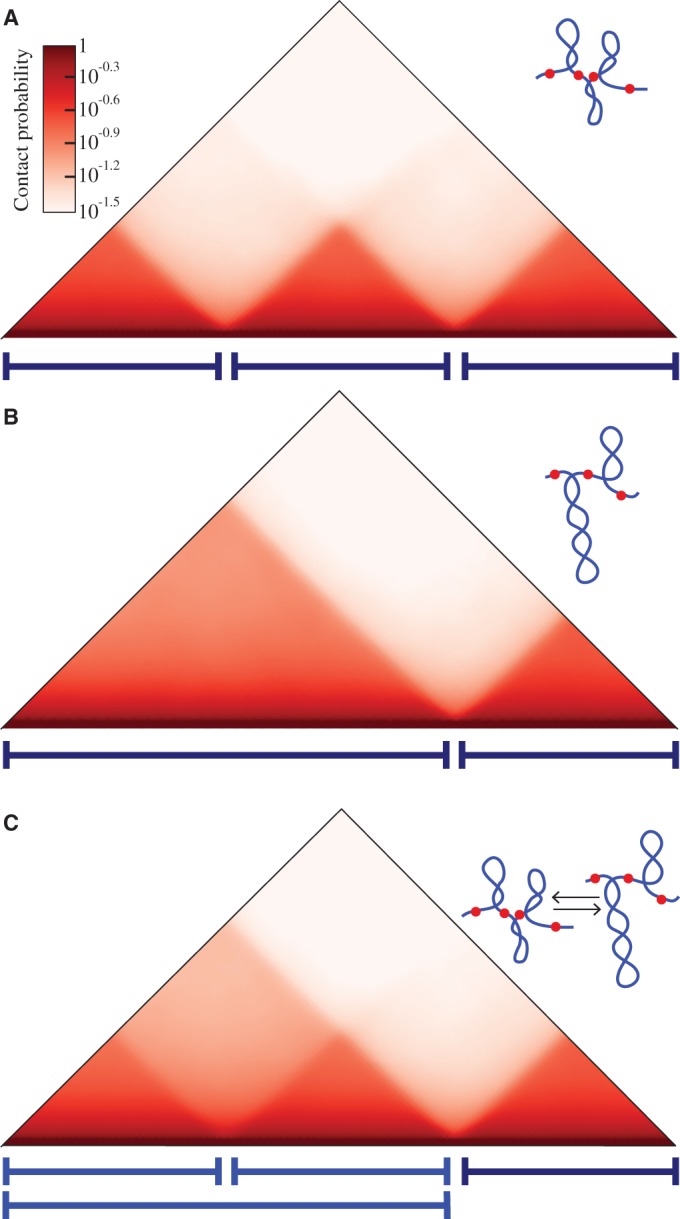
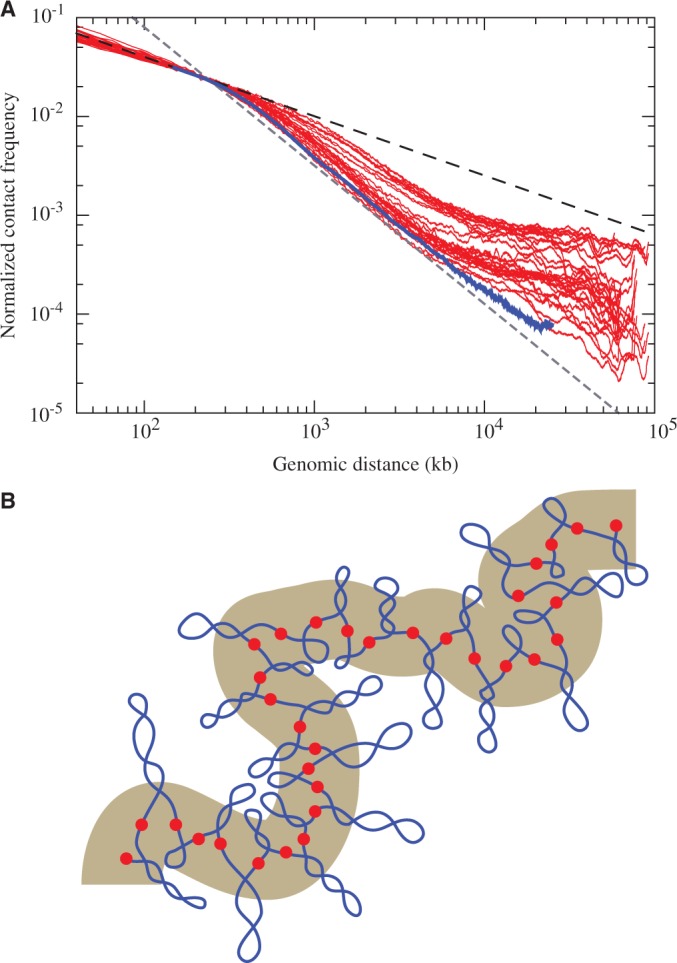
Understanding the structure of interphase chromosomes is essential to elucidate regulatory mechanisms of gene expression. During recent years, high-throughput DNA sequencing expanded the power of chromosome conformation capture (3C) methods that provide information about reciprocal spatial proximity of chromosomal loci. Since 2012, it is known that entire chromatin in interphase chromosomes is organized into regions with strongly increased frequency of internal contacts. These regions, with the average size of ∼1 Mb, were named topological domains. More recent studies demonstrated presence of unconstrained supercoiling in interphase chromosomes. Using Brownian dynamics simulations, we show here that by including supercoiling into models of topological domains one can reproduce and thus provide possible explanations of several experimentally observed characteristics of interphase chromosomes, such as their complex contact maps.


Figures

Figure 1.
Figure 1.
Models that impose strong supercoiling of individual topological domains recapitulate experimental 3C data. (A, B) Contact maps obtained for simulated chromatin fibres composed of two topological domains A and B with sizes corresponding to 800 and 400 kb that were weakly (panel A) or strongly supercoiled (panel B) (with ΔLk of −1 or of −8 per 400 kb, respectively). The two drawings schematically present the two systems. (C, D) Comparison of the average contact probability profiles for loci located in the same or neighbouring topological domains for modelled chromatin fibres composed of weakly or strongly supercoiled topological domains (panels C and D, respectively) with experimental 3C data. Notations AA, BB and AB indicate intra- and interdomain contacts, respectively, for simulated topological domains. The experimental 3C data points (shown as scatter plots in C–D) correspond to contacts within and between topological domains E, F and H presented in Figure 1 of Nora et al. (3). The dashed line indicates the slope corresponding to the α exponent of −0.6.
Figure 2.
Figure 2.
Simple loop models of topological domains do not recapitulate the 3C data. (A) Contact maps obtained for a simple loop model of two topological domains with sizes corresponding to 800 and 400 kb, respectively. (B) Contact probability profiles obtained in simulations of topological domains as non-supercoiled loops (indicated with continuous lines) and 3C data for individual topological domains E, F and H presented in Figure 1 of Nora et al. (3). Notice that in contrast to the model presented in Figure 1, the simple loop models fail to reproduce the experimental data.
Figure 3.
Figure 3.
Simulations reveal local compaction of individual topological domains. Snapshot from the simulation run that provided the data for Figure 1B. One chromatin fragment consisting of two supercoiled topological domains with sizes corresponding to 800 and 400 kb was simulated under periodic boundary conditions. For better visibility, one of the periodic copies of the simulated fragment composed of two supercoiled topological domains is partially ‘extracted’ from highly crowded melt composed of other periodic copies of the same molecule. The image shows eight periodic copies of the actual simulation box. Notice local compaction of individual supercoiled topological domains.
Figure 4.
Figure 4.
Transient border elements explain the substructure of contact maps. (A, B) Contact maps obtained after simulations of a chromosome region that in the first case (A) forms three supercoiled topological domains (where the first one is roughly twice bigger than the second) and in the second case (B) forms two supercoiled domains, as one transient border element is active in this case. (C) Combined contact matrix corresponding to the situation where the transient border element is active 50% of the time. Schematic drawings present situations corresponding to respective contact maps.
Figure 5.
Figure 5.
Model of a large chromosome fragment composed of supercoiled topological domains recapitulates the experimentally observed changes of α exponent as the genomic separation between contacting regions increases. (A) The contact decay profile obtained in simulations of a large chromosome fragment with ∼60 Mb (blue line) is overlaid on experimentally determined contact decay profiles extracted from 3C data collected by Dixon et al. (2). The experimental profiles are for several different chromosomes with the size of ∼60 Mb, which were analysed in different cell lines. Each red line is for a given chromosome and a given cell line. Experimental profiles were rescaled so that the contact frequency observed at loci separation of 200 kb corresponded to contact probability observed in simulations for separations corresponding to 200 kb. The simulated profile starts with the size of five beads, as below that number the coarse graining is not suited to adequately evaluate contact frequencies. The simulated profile is shown up to 25 Mb, as beyond that scale the values were strongly affected by insufficient simulation time. The thickness of the blue line is larger than one standard deviation error bars evaluated using the blocking method (27). The dashed black and grey lines indicate slopes corresponding to α exponents of −0.6 and −1.4, respectively. (B) Schematic drawing of a large chromosome fragment composed of supercoiled domains with different sizes and different extent of supercoiling. On a large scale such fragment is expected to behave like an elastic generic polymer (shown as a thick grey tube).

References

    1. Sexton T, Yaffe E, Kenigsberg E, Bantignies F, Leblanc B, Hoichman M, Parrinello H, Tanay A, Cavalli G. Three-dimensional folding and functional organization principles of the Drosophila genome. Cell. 2012;148:458–472. - PubMed
    1. Dixon JR, Selvaraj S, Yue F, Kim A, Li Y, Shen Y, Hu M, Liu JS, Ren B. Topological domains in mammalian genomes identified by analysis of chromatin interactions. Nature. 2012;485:376–380. - PMC - PubMed
    1. Nora EP, Lajoie BR, Schulz EG, Giorgetti L, Okamoto I, Servant N, Piolot T, van Berkum NL, Meisig J, Sedat J, et al. Spatial partitioning of the regulatory landscape of the X-inactivation centre. Nature. 2012;485:381–385. - PMC - PubMed
    1. Hou C, Li L, Qin ZS, Corces VG. Gene density, transcription, and insulators contribute to the partition of the Drosophila genome into physical domains. Mol. Cell. 2012;48:471–484. - PMC - PubMed
    1. Dekker J, Marti-Renom MA, Mirny LA. Exploring the three-dimensional organization of genomes: interpreting chromatin interaction data. Nat. Rev. Genet. 2013;14:390–403. - PMC - PubMed

Publication types