

Quantitative multiparametric MRI assessment of glioma response to radiotherapy in a rat model
- PMID: 24366911
- PMCID: PMC4022217
- DOI: 10.1093/neuonc/not245
Quantitative multiparametric MRI assessment of glioma response to radiotherapy in a rat model
Abstract
Background: The inability of structural MRI to accurately measure tumor response to therapy complicates care management for patients with gliomas. The purpose of this study was to assess the potential of several noninvasive functional and molecular MRI biomarkers for the assessment of glioma response to radiotherapy.
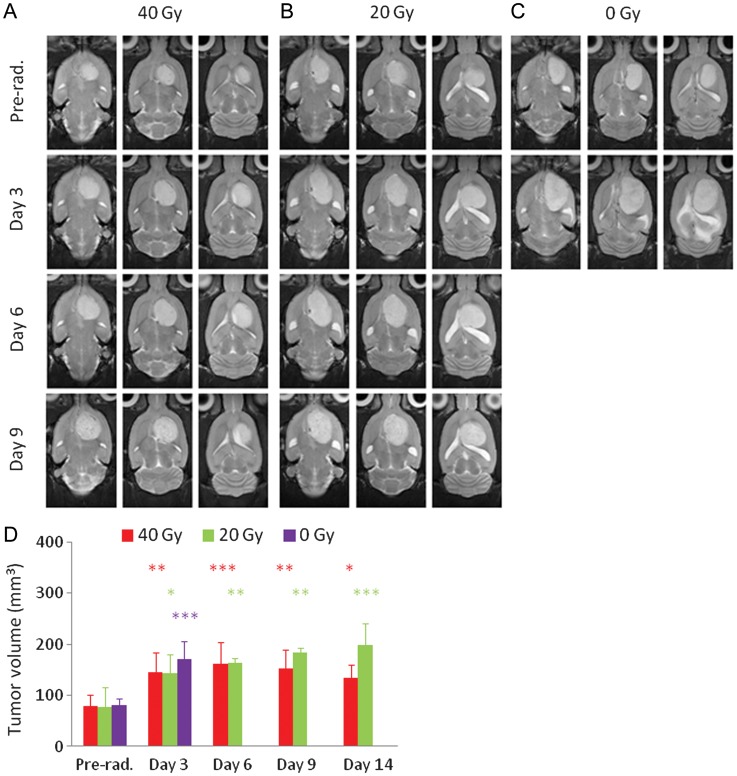
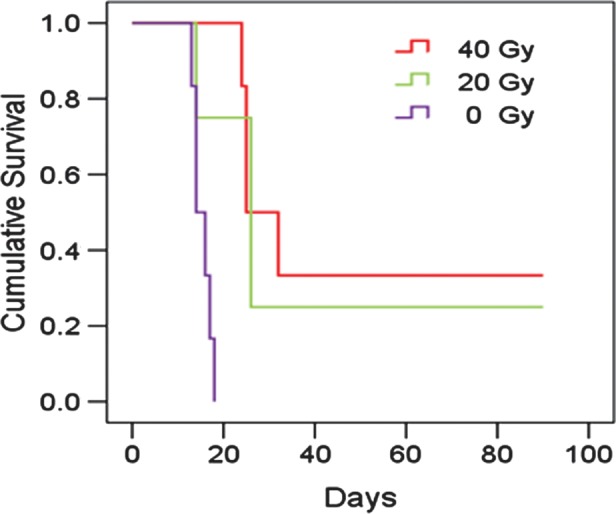
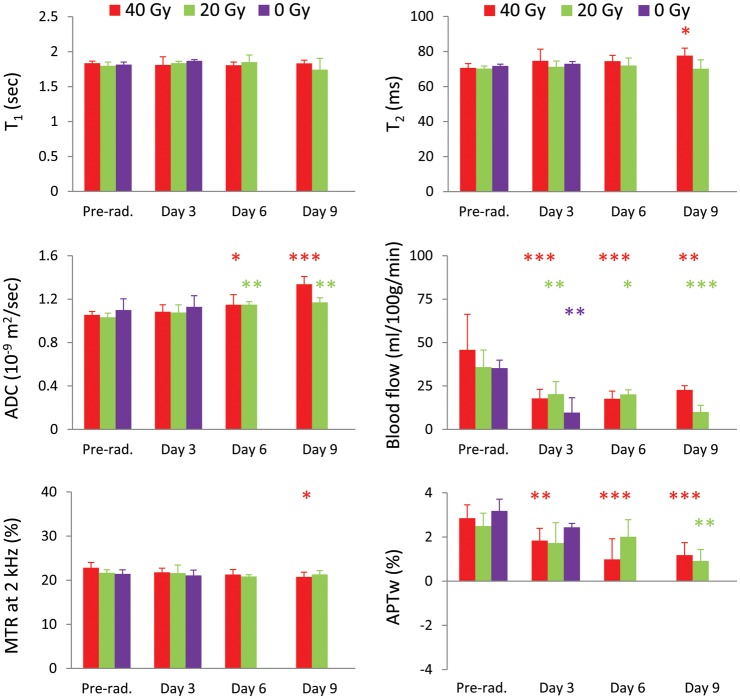
Methods: Fourteen U87 tumor-bearing rats were irradiated using a small-animal radiation research platform (40 or 20 Gy), and 6 rats were used as controls. MRI was performed on a 4.7 T animal scanner, preradiation treatment, as well as at 3, 6, 9, and 14 days postradiation. Image features of the tumors, as well as tumor volumes and animal survival, were quantitatively compared.
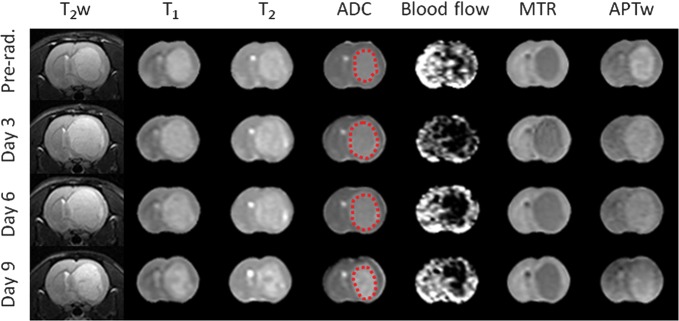
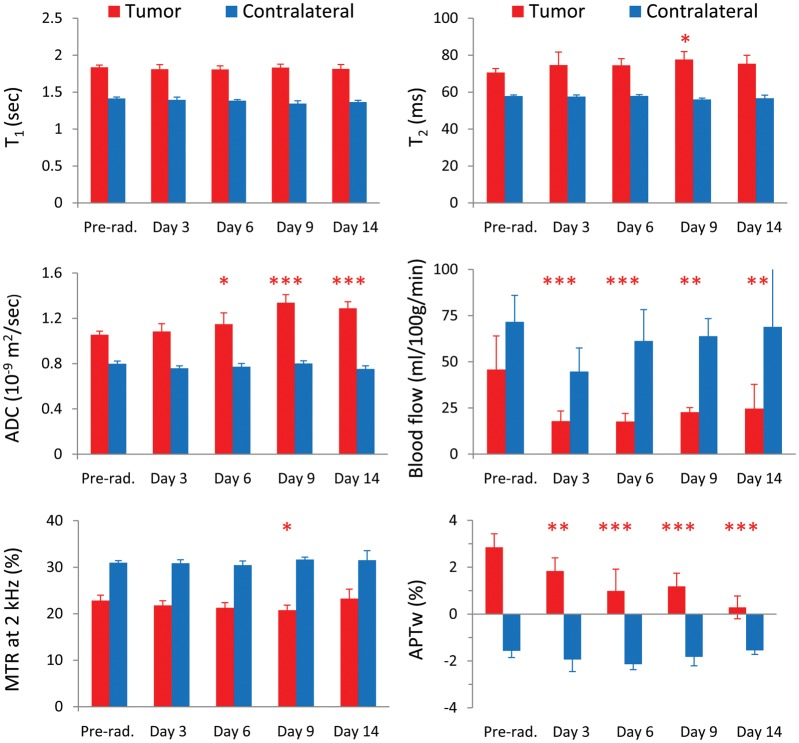
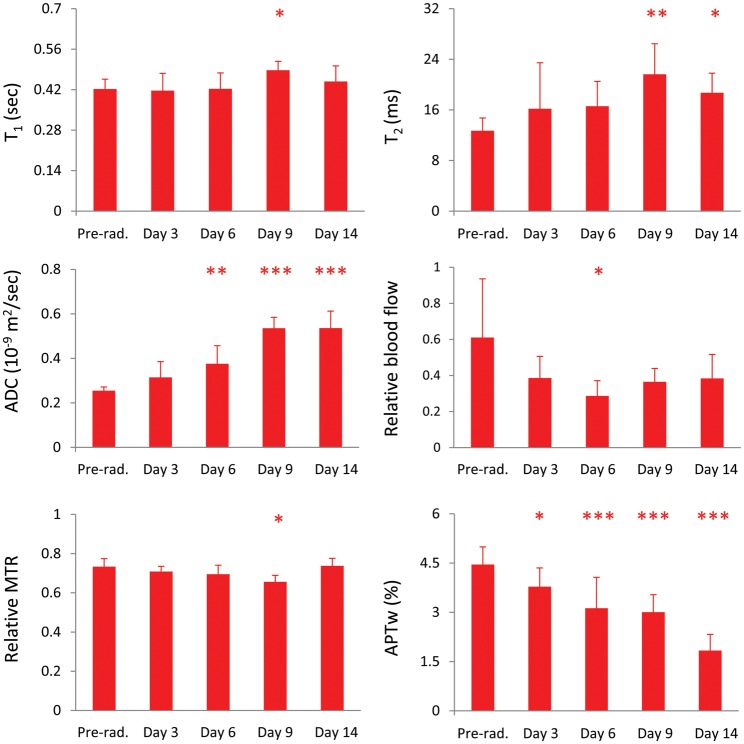
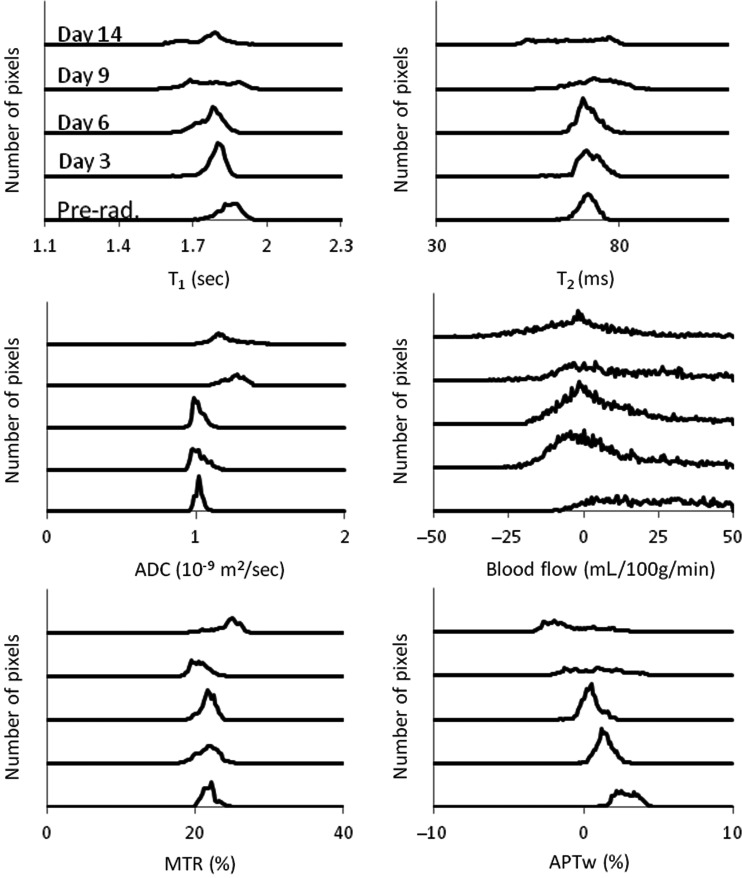
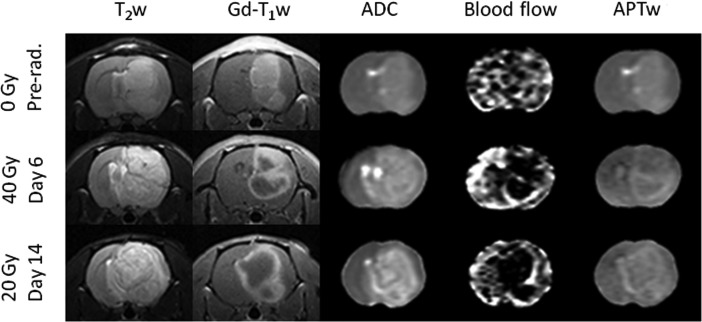
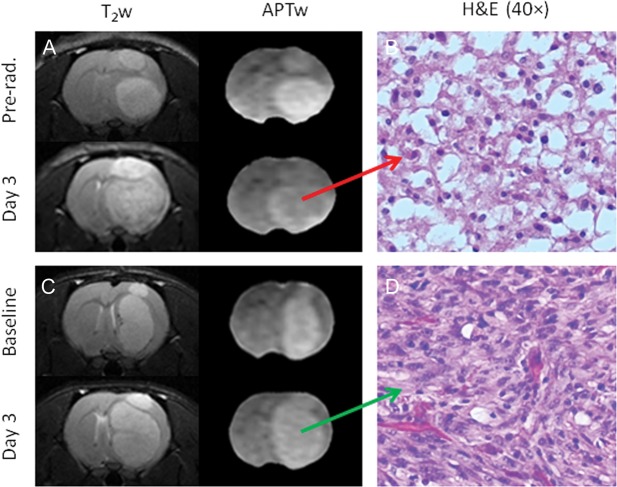
Results: Structural MRI showed that all irradiated tumors still grew in size during the initial days postradiation. The apparent diffusion coefficient (ADC) values of tumors increased significantly postradiation (40 and 20 Gy), except at day 3 postradiation, compared with preradiation. The tumor blood flow decreased significantly postradiation (40 and 20 Gy), but the relative blood flow (tumor vs contralateral) did not show a significant change at most time points postradiation. The amide proton transfer weighted (APTw) signals of the tumor decreased significantly at all time points postradiation (40 Gy), and also at day 9 postradiation (20 Gy). The blood flow and APTw maps demonstrated tumor features that were similar to those seen on gadolinium-enhanced T1-weighted images.
Conclusions: Tumor ADC, blood flow, and APTw were all useful imaging biomarkers by which to predict glioma response to radiotherapy. The APTw signal was most promising for early response assessment in this model.
Keywords: APT imaging; glioma; multiparametric MRI; radiotherapy; response assessment.
© The Author(s) 2013. Published by Oxford University Press on behalf of the Society for Neuro-Oncology. All rights reserved. For permissions, please e-mail: journals.permissions@oup.com.
Figures
Similar articles
-
Quantitative correlational study of microbubble-enhanced ultrasound imaging and magnetic resonance imaging of glioma and early response to radiotherapy in a rat model.Med Phys. 2015 Aug;42(8):4762-72. doi: 10.1118/1.4926550. Med Phys. 2015. PMID: 26233204 Free PMC article.
-
Assessment of Glioma Response to Radiotherapy Using Multiple MRI Biomarkers with Manual and Semiautomated Segmentation Algorithms.J Neuroimaging. 2016 Nov;26(6):626-634. doi: 10.1111/jon.12354. Epub 2016 Apr 29. J Neuroimaging. 2016. PMID: 27128445 Free PMC article.
-
Monochromatic minibeams radiotherapy: from healthy tissue-sparing effect studies toward first experimental glioma bearing rats therapy.Int J Radiat Oncol Biol Phys. 2012 Mar 15;82(4):e693-700. doi: 10.1016/j.ijrobp.2011.09.013. Epub 2012 Jan 21. Int J Radiat Oncol Biol Phys. 2012. PMID: 22270173
-
Radiotherapy of high-grade gliomas: current standards and new concepts, innovations in imaging and radiotherapy, and new therapeutic approaches.Chin J Cancer. 2014 Jan;33(1):16-24. doi: 10.5732/cjc.013.10217. Chin J Cancer. 2014. PMID: 24384237 Free PMC article. Review.
-
Amide proton transfer-weighted MRI in distinguishing high- and low-grade gliomas: a systematic review and meta-analysis.Neuroradiology. 2019 May;61(5):525-534. doi: 10.1007/s00234-018-02152-2. Epub 2019 Jan 21. Neuroradiology. 2019. PMID: 30666352
Cited by
-
Molecular MRI differentiation between primary central nervous system lymphomas and high-grade gliomas using endogenous protein-based amide proton transfer MR imaging at 3 Tesla.Eur Radiol. 2016 Jan;26(1):64-71. doi: 10.1007/s00330-015-3805-1. Epub 2015 Apr 30. Eur Radiol. 2016. PMID: 25925361 Free PMC article.
-
Role of the Apparent Diffusion Coefficient as a Predictor of Tumor Progression in Patients with Chordoma.AJNR Am J Neuroradiol. 2018 Jul;39(7):1316-1321. doi: 10.3174/ajnr.A5664. Epub 2018 May 3. AJNR Am J Neuroradiol. 2018. PMID: 29724767 Free PMC article.
-
Added value of amide proton transfer imaging to conventional and perfusion MR imaging for evaluating the treatment response of newly diagnosed glioblastoma.Eur Radiol. 2016 Dec;26(12):4390-4403. doi: 10.1007/s00330-016-4261-2. Epub 2016 Feb 16. Eur Radiol. 2016. PMID: 26883333
-
Quantitative correlational study of microbubble-enhanced ultrasound imaging and magnetic resonance imaging of glioma and early response to radiotherapy in a rat model.Med Phys. 2015 Aug;42(8):4762-72. doi: 10.1118/1.4926550. Med Phys. 2015. PMID: 26233204 Free PMC article.
-
Assessing Amide Proton Transfer (APT) MRI Contrast Origins in 9 L Gliosarcoma in the Rat Brain Using Proteomic Analysis.Mol Imaging Biol. 2015 Aug;17(4):479-87. doi: 10.1007/s11307-015-0828-6. Mol Imaging Biol. 2015. PMID: 25622812 Free PMC article.
References
-
- Wen PY, Kesari S. Malignant gliomas in adults. N Engl J Med. 2008;359(5):492–507. - PubMed
-
- Walker MD, Alexander E, Jr., Hunt WE, et al. Evaluation of BCNU and/or radiotherapy in the treatment of anaplastic gliomas. A cooperative clinical trial. J Neurosurg. 1978;49(3):333–343. - PubMed
-
- Macdonald DR, Cascino TL, Schold SC, et al. Response criteria for phase II studies of supratentorial malignant glioma. J Clin Oncol. 1990;8(7):1277–1280. - PubMed
-
- Burger PC, Dubois PJ, Schold SC, Jr., et al. Computerized tomographic and pathologic studies of the untreated, quiescent, and recurrent glioblastoma multiforme. J Neurosurg. 1983;58(2):159–169. - PubMed
-
- Kumar AJ, Leeds NE, Fuller GN, et al. Malignant gliomas: MR imaging spectrum of radiation therapy- and chemotherapy-induced necrosis of the brain after treatment. Radiology. 2000;217(2):377–384. - PubMed
Publication types
MeSH terms
Substances
Grants and funding
LinkOut - more resources
Full Text Sources
Other Literature Sources
Medical
