

Cell adhesion defines the topology of endocytosis and signaling
- PMID: 24366944
- PMCID: PMC3990681
- DOI: 10.1002/embj.201385284
Cell adhesion defines the topology of endocytosis and signaling
Abstract
Preferred sites of endocytosis have been observed in various cell types, but whether they occur randomly or are linked to cellular cues is debated. Here, we quantified the sites of endocytosis of transferrin (Tfn) and epidermal growth factor (EGF) in cells whose adhesion geometry was defined by micropatterns. 3D probabilistic density maps revealed that Tfn was enriched in adhesive sites during uptake, whereas EGF endocytosis was restricted to the dorsal cellular surface. This spatial separation was not due to distributions of corresponding receptors but was regulated by uptake mechanisms. Asymmetric uptake of Tfn resulted from the enrichment of clathrin and adaptor protein 2 at adhesive areas. Asymmetry in EGF uptake was strongly dependent on the actin cytoskeleton and led to asymmetry in EGF receptor activation. Mild alteration of actin dynamics abolished asymmetry in EGF uptake and decreased EGF-induced downstream signaling, suggesting that cellular adhesion cues influence signal propagation. We propose that restriction of endocytosis at distinct sites allows cells to sense their environment in an "outside-in" mechanism.
Figures
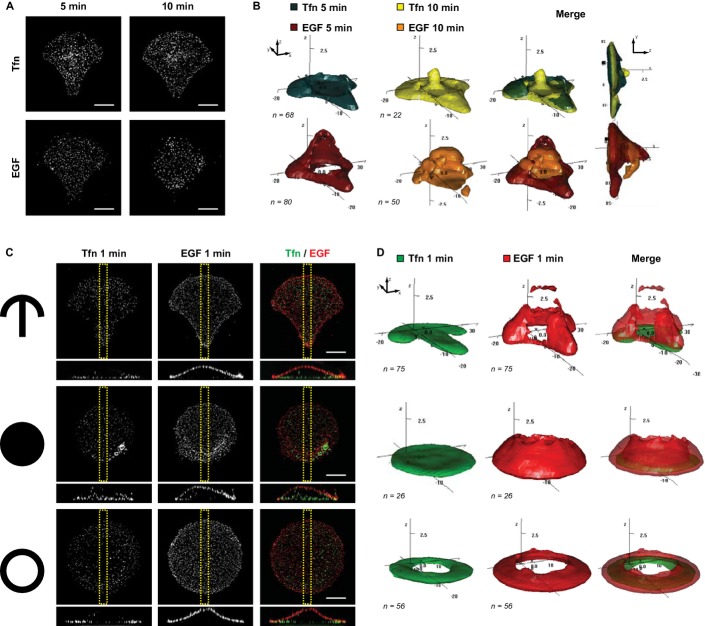
Maximum intensity projection (MIP) of fluorescently marked Tfn (upper panel) and EGF (lower panel) in single crossbow-shaped micropatterned cells 5 and 10 min after ligand addition. Scale bars, 10 μm.
Corresponding 3D density maps of the 50% probability contour of Tfn (upper panel) and (EGF lower panel) at 5 and 10 min for n cells. Density maps are shown in two different views and represent the smallest regions in which 50% of fluorescent structures are found. For ease of visualization, the height (z axis) has been stretched fivefold.
MIPs and merged images of fluorescently marked Tfn and EGF in single crossbow-shaped (upper panel), disc-shaped (middle panel) and ring-shaped (lower panel) cells after 1 min of ligand addition. Corresponding y–z projections (of the yellow region) are shown at the bottom. Scale bars, 10 μm.
Corresponding 3D density maps of the 50% probability contour of Tfn (green) and EGF (red) for n cells.
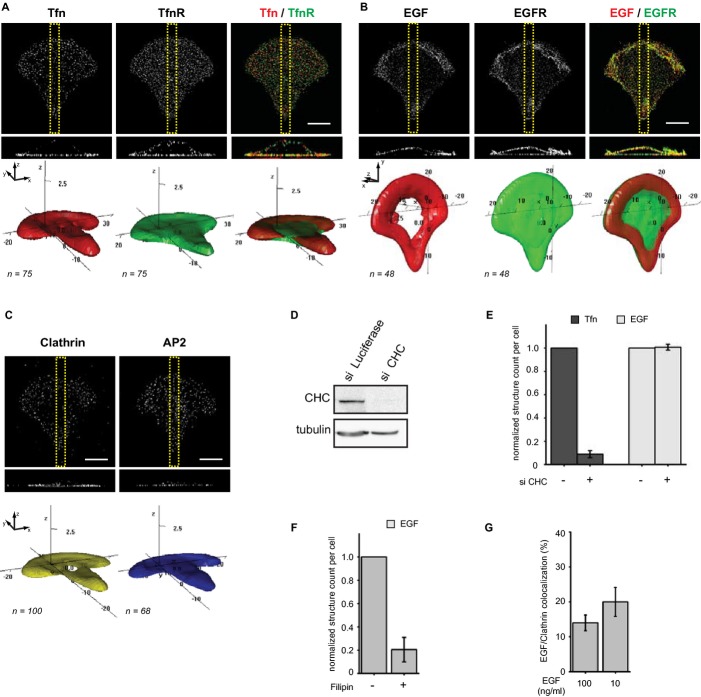

MIP (upper panel) of fluorescently marked Tfn in crossbow-shaped micropatterned cells treated with dimethyl sulfoxide (DMSO, left panel), Cytochalasin D (CD, middle panel) or Nocodazole (NZ, right panel) after 1 min of ligand addition and corresponding 3D density maps of the 50 % probability contour for n cells (lower panel).
MIP (upper panel) of immunostained AP2 in DMSO, CD and NZ treated cells and corresponding 3D density maps of the 50 % probability contour for n cells (lower panel).
Normalized count of Tfn structures per cell after treatment with DMSO, CD and NZ from three independent experiments and n cells.
Normalized count of EGF structures per cell after treatment with DMSO, CD and NZ from two independent experiments and n cells.
MIP (upper panel) of fluorescently marked EGF in DMSO, CD and NZ treated cells after 1 min of ligand addition and corresponding 3D density maps of the 50 % probability contour for n cells (lower panel).

TIRFM images of micropatterned cells stably expressing EGFP-clathrin heavy chain treated with DMSO (left panel) or CD (right panel) 1 min after addition of marked Tfn (upper panel) or EGF (lower panel). Three time frames are shown. Scale bars, 5 μm.
Co-localization analysis of EGF and Tfn with clathrin at the lower plasma membrane in the absence and presence of CD from TIRFM data presented in (A). Average clathrin occupancy by ligand per movie frame is shown. Error bars are s.d.
Co-localization analysis of clathrin with EGF and Tfn in the absence and presence of CD, for ≥ 40 cells per condition from two independent experiments. Error bars are s.d.

Immunoblot analysis of lysates from cells treated with DMSO or CD and stimulated with EGF for different time points.
Corresponding densitometry analysis of p-EGFR, p-Akt, p-ERK1/2 with tubulin from three independent experiments. Error bars are s.d. Student's t-test results are: *P < 0.05, **P < 0.01, ***P < 0.001.
Ratiometric analysis of micropatterned cells stably expressing FLAME treated with DMSO (left panel) or CD (right panel) and stimulated with EGF followed by treatment with 100 ng/ml AG1478. Cherry/GFP ratios are presented in three z planes of a non-stimulated cell (left panel), after EGF stimulation (middle panel) and after addition of AG1478 (right panel). Scale bars, 10 μm.
Quantification of ratiometric experiments presented in (C) for at least three cells per condition.
Model of how actin based asymmetry in endocytosis may determine polarized downstream signaling.
Comment in
-
Why does endocytosis in single cells care which side up?Bioarchitecture. 2014 Mar-Apr;4(2):62-7. doi: 10.4161/bioa.28809. Epub 2014 Apr 9. Bioarchitecture. 2014. PMID: 24717194 Free PMC article.
References
-
- Azioune A, Storch M, Bornens M, Thery M, Piel M. Simple and rapid process for single cell micro-patterning. Lab Chip. 2009;9:1640–1642. - PubMed
-
- Bolte S, Cordelieres FP. A guided tour into subcellular colocalization analysis in light microscopy. J Microsc. 2006;224:213–232. - PubMed
-
- Chung I, Akita R, Vandlen R, Toomre D, Schlessinger J, Mellman I. Spatial control of EGF receptor activation by reversible dimerization on living cells. Nature. 2010;464:783–787. - PubMed
Publication types
MeSH terms
Substances
LinkOut - more resources
Full Text Sources
Other Literature Sources
