

Bach2 regulates homeostasis of Foxp3+ regulatory T cells and protects against fatal lung disease in mice
- PMID: 24367030
- PMCID: PMC3946995
- DOI: 10.4049/jimmunol.1302378
Bach2 regulates homeostasis of Foxp3+ regulatory T cells and protects against fatal lung disease in mice
Abstract
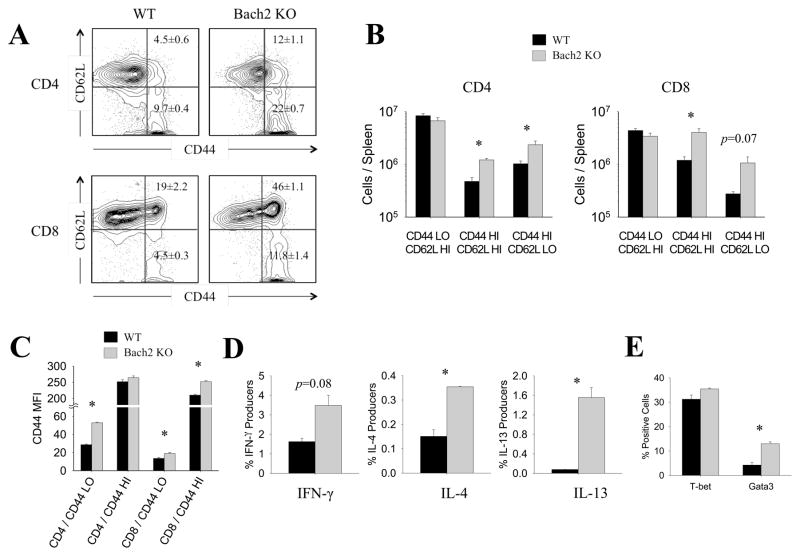
Variants of the Bach2 gene are linked to vitiligo, celiac disease, and type 1 diabetes, but the underlying immunological mechanisms are unknown. In this study, we demonstrate that Bach2 plays crucial roles in maintaining T cell quiescence and governing the differentiation, activation, and survival of Foxp3(+) regulatory T (Treg) cells. Bach2-deficient T cells display spontaneous activation and produce elevated levels of Th1/Th2-type cytokines. Without Bach2, Treg cells exhibit diminished Foxp3 expression, depleted numbers, hyperactivation, enhanced proliferation, and profound loss of competitive fitness in vivo. Mechanistically, reduced survival of Bach2-deficient Treg cells was associated with reduced Bcl-2 and Mcl-1 levels and elevated Bim/Bcl-2 ratio. Additionally, Bach2 deficiency induced selective loss of Helios(-)Foxp3(+) Treg cells and a Treg cell transcriptome skewed toward the Th1/Th2 effector program at the expense of the Treg program. In vitro experiments confirmed that Bach2: 1) is indispensable for TCR/TGF-β-induced Foxp3 expression; and 2) mitigates aberrant differentiation of Treg cells by repression of the competing Gata3-driven Th2 effector program. Importantly, perturbations in the differentiation of induced Treg cells was linked to a fatal Th2-type chronic inflammatory lung disease in Bach2-deficient mice. Thus, Bach2 enforces T cell quiescence, promotes the development and survival of Treg lineage, restrains aberrant differentiation of Treg cells, and protects against immune-mediated diseases.
Figures


Similar articles
-
Attenuation of TCR-induced transcription by Bach2 controls regulatory T cell differentiation and homeostasis.Nat Commun. 2020 Jan 14;11(1):252. doi: 10.1038/s41467-019-14112-2. Nat Commun. 2020. PMID: 31937752 Free PMC article.
-
BACH2 represses effector programs to stabilize T(reg)-mediated immune homeostasis.Nature. 2013 Jun 27;498(7455):506-10. doi: 10.1038/nature12199. Epub 2013 Jun 2. Nature. 2013. PMID: 23728300 Free PMC article.
-
The transcriptional repressor Bcl6 controls the stability of regulatory T cells by intrinsic and extrinsic pathways.Immunology. 2015 May;145(1):11-23. doi: 10.1111/imm.12393. Immunology. 2015. PMID: 25262912 Free PMC article.
-
The Critical Role of Bach2 in Shaping the Balance between CD4+ T Cell Subsets in Immune-Mediated Diseases.Mediators Inflamm. 2019 Dec 30;2019:2609737. doi: 10.1155/2019/2609737. eCollection 2019. Mediators Inflamm. 2019. PMID: 32082072 Free PMC article. Review.
-
BACH2: The Future of Induced T-Regulatory Cell Therapies.Cells. 2024 May 22;13(11):891. doi: 10.3390/cells13110891. Cells. 2024. PMID: 38891024 Free PMC article. Review.
Cited by
-
BATF-Interacting Proteins Dictate Specificity in Th Subset Activity.J Immunol. 2019 Oct 1;203(7):1989-1998. doi: 10.4049/jimmunol.1900128. Epub 2019 Aug 26. J Immunol. 2019. PMID: 31451674 Free PMC article.
-
Unilateral zebrafish corneal injury induces bilateral cell plasticity supporting wound closure.Sci Rep. 2022 Jan 7;12(1):161. doi: 10.1038/s41598-021-04086-x. Sci Rep. 2022. PMID: 34997071 Free PMC article.
-
Epigenetic Regulation of the Blimp-1 Gene (Prdm1) in B Cells Involves Bach2 and Histone Deacetylase 3.J Biol Chem. 2016 Mar 18;291(12):6316-30. doi: 10.1074/jbc.M116.713842. Epub 2016 Jan 19. J Biol Chem. 2016. PMID: 26786103 Free PMC article.
-
The Transcription Factor Bach2 Is Phosphorylated at Multiple Sites in Murine B Cells but a Single Site Prevents Its Nuclear Localization.J Biol Chem. 2016 Jan 22;291(4):1826-1840. doi: 10.1074/jbc.M115.661702. Epub 2015 Nov 30. J Biol Chem. 2016. PMID: 26620562 Free PMC article.
-
MiR-31 promotes Th22 differentiation through targeting Bach2 in coronary heart disease.Biosci Rep. 2019 Sep 20;39(9):BSR20190986. doi: 10.1042/BSR20190986. Print 2019 Sep 30. Biosci Rep. 2019. PMID: 31501353 Free PMC article.
References
-
- Mueller DL. Mechanisms maintaining peripheral tolerance. Nat Immunol. 2010;11:21–27. - PubMed
-
- Sakaguchi S, Yamaguchi T, Nomura T, Ono M. Regulatory T cells and immune tolerance. Cell. 2008;133:775–787. - PubMed
-
- von Boehmer H, Melchers F. Checkpoints in lymphocyte development and autoimmune disease. Nat Immunol. 2010;11:14–20. - PubMed
Publication types
MeSH terms
Substances
Associated data
- Actions
Grants and funding
LinkOut - more resources
Full Text Sources
Other Literature Sources
Molecular Biology Databases
