

Spatial organization of lipids in the human retina and optic nerve by MALDI imaging mass spectrometry
- PMID: 24367044
- PMCID: PMC3934734
- DOI: 10.1194/jlr.M044990
Spatial organization of lipids in the human retina and optic nerve by MALDI imaging mass spectrometry
Abstract
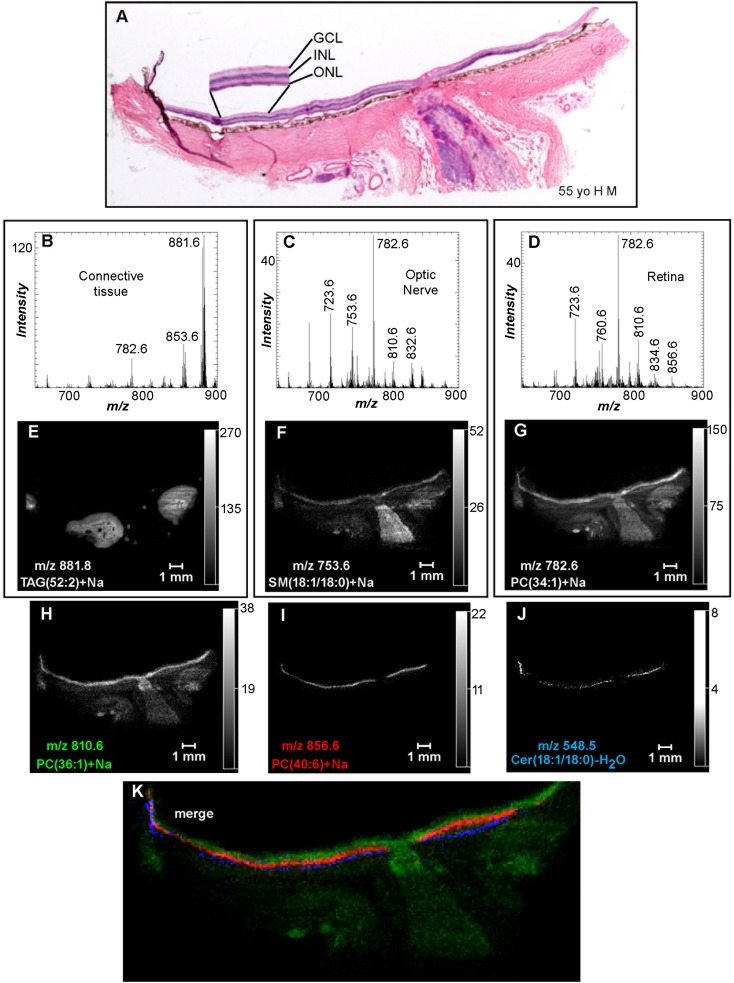
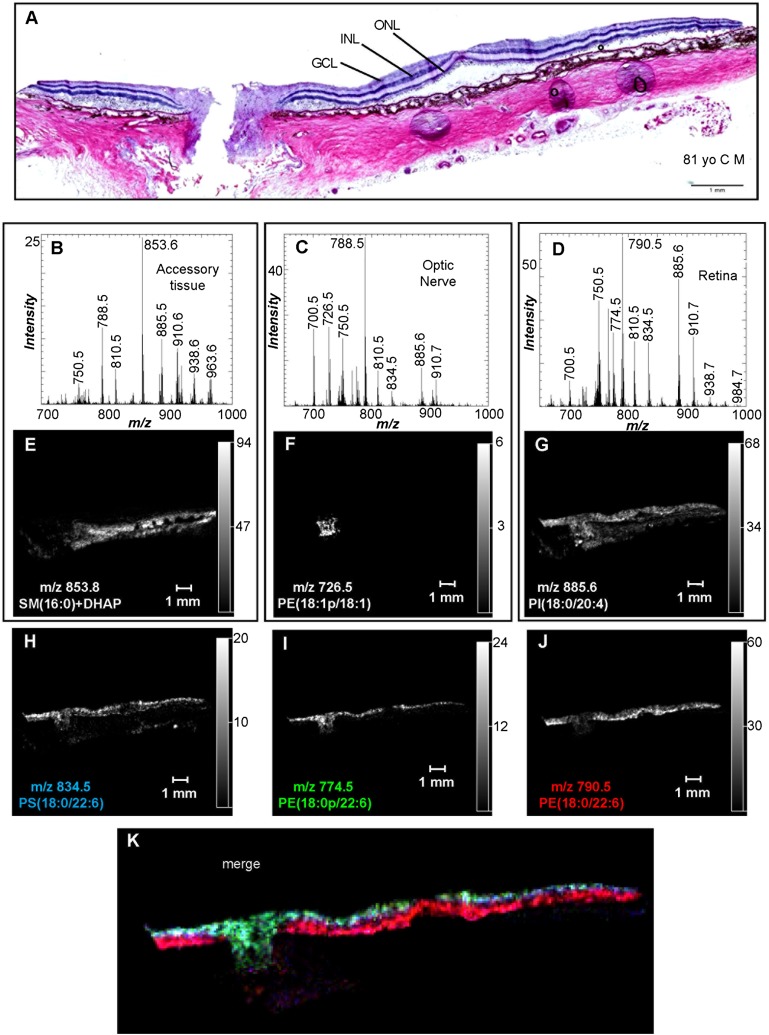
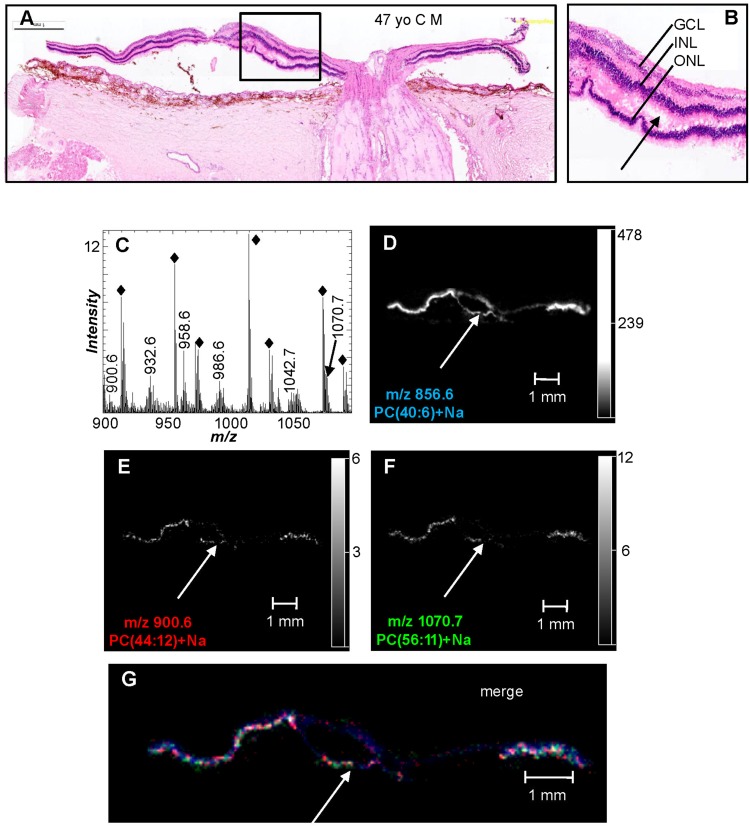
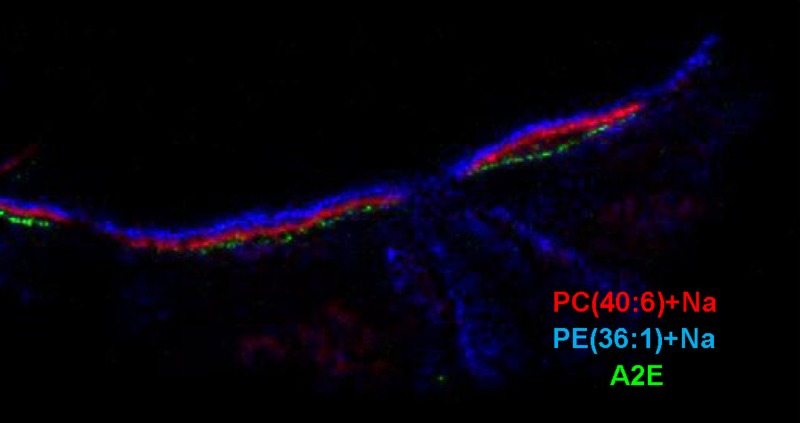
MALDI imaging mass spectrometry (IMS) was used to characterize lipid species within sections of human eyes. Common phospholipids that are abundant in most tissues were not highly localized and observed throughout the accessory tissue, optic nerve, and retina. Triacylglycerols were highly localized in accessory tissue, whereas sulfatide and plasmalogen glycerophosphoethanolamine (PE) lipids with a monounsaturated fatty acid were found enriched in the optic nerve. Additionally, several lipids were associated solely with the inner retina, photoreceptors, or retinal pigment epithelium (RPE); a plasmalogen PE lipid containing DHA (22:6), PE(P-18:0/22:6), was present exclusively in the inner retina, and DHA-containing glycerophosphatidylcholine (PC) and PE lipids were found solely in photoreceptors. PC lipids containing very long chain (VLC)-PUFAs were detected in photoreceptors despite their low abundance in the retina. Ceramide lipids and the bis-retinoid, N-retinylidene-N-retinylethanolamine, was tentatively identified and found only in the RPE. This MALDI IMS study readily revealed the location of many lipids that have been associated with degenerative retinal diseases. Complex lipid localization within retinal tissue provides a global view of lipid organization and initial evidence for specific functions in localized regions, offering opportunities to assess their significance in retinal diseases, such as macular degeneration, where lipids have been implicated in the disease process.
Keywords: ceramide; docosahexaenoic acid; lipid characterization; lipid localization; very long chain polyunsaturated fatty acids.
Figures
Similar articles
-
High resolution MALDI imaging mass spectrometry of retinal tissue lipids.J Am Soc Mass Spectrom. 2014 Aug;25(8):1394-403. doi: 10.1007/s13361-014-0883-2. Epub 2014 May 13. J Am Soc Mass Spectrom. 2014. PMID: 24819461 Free PMC article.
-
Lipid Landscape of the Human Retina and Supporting Tissues Revealed by High-Resolution Imaging Mass Spectrometry.J Am Soc Mass Spectrom. 2020 Dec 2;31(12):2426-2436. doi: 10.1021/jasms.0c00119. Epub 2020 Jul 24. J Am Soc Mass Spectrom. 2020. PMID: 32628476 Free PMC article.
-
Lipid composition of the human eye: are red blood cells a good mirror of retinal and optic nerve fatty acids?PLoS One. 2012;7(4):e35102. doi: 10.1371/journal.pone.0035102. Epub 2012 Apr 9. PLoS One. 2012. PMID: 22496896 Free PMC article.
-
Surface analysis of lipids by mass spectrometry: more than just imaging.Prog Lipid Res. 2013 Oct;52(4):329-53. doi: 10.1016/j.plipres.2013.04.005. Epub 2013 Apr 24. Prog Lipid Res. 2013. PMID: 23623802 Review.
-
Dynamic lipid turnover in photoreceptors and retinal pigment epithelium throughout life.Prog Retin Eye Res. 2022 Jul;89:101037. doi: 10.1016/j.preteyeres.2021.101037. Epub 2021 Dec 29. Prog Retin Eye Res. 2022. PMID: 34971765 Free PMC article. Review.
Cited by
-
Tissue fixation effects on human retinal lipid analysis by MALDI imaging and LC-MS/MS technologies.J Mass Spectrom. 2021 Dec;56(12):e4798. doi: 10.1002/jms.4798. J Mass Spectrom. 2021. PMID: 34881479 Free PMC article.
-
Optic Nerve Regeneration After Crush Remodels the Injury Site: Molecular Insights From Imaging Mass Spectrometry.Invest Ophthalmol Vis Sci. 2018 Jan 1;59(1):212-222. doi: 10.1167/iovs.17-22509. Invest Ophthalmol Vis Sci. 2018. PMID: 29340649 Free PMC article.
-
Patch clamp-assisted single neuron lipidomics.Sci Rep. 2017 Jul 13;7(1):5318. doi: 10.1038/s41598-017-05607-3. Sci Rep. 2017. PMID: 28706218 Free PMC article.
-
Lutein and Brain Function.Foods. 2015 Dec;4(4):547-564. doi: 10.3390/foods4040547. Epub 2015 Oct 9. Foods. 2015. PMID: 26566524 Free PMC article.
-
ω-3 and ω-6 long-chain PUFAs and their enzymatic metabolites in neovascular eye diseases.Am J Clin Nutr. 2017 Jul;106(1):16-26. doi: 10.3945/ajcn.117.153825. Epub 2017 May 17. Am J Clin Nutr. 2017. PMID: 28515072 Free PMC article. Review.
References
-
- Yu D-Y., Cringle S. J., Balaratnasingam C., Morgan W. H., Yu P. K., Su E-N. 2013. Retinal ganglion cells: energetics, compartmentation, axonal transport, cytoskeletons and vulnerability. Prog. Retin. Eye Res. 36: 217–246 - PubMed
-
- Kawamura S., Tachibanaki S. 2008. Rod and cone photoreceptors: molecular basis of the difference in their physiology. Comp. Biochem. Physiol. A Mol. Integr. Physiol. 150: 369–377 - PubMed
-
- Fliesler S. J., Anderson R. E. 1983. Chemistry and metabolism of lipids in the vertebrate retina. Prog. Lipid Res. 22: 79–131 - PubMed
Publication types
MeSH terms
Substances
Grants and funding
LinkOut - more resources
Full Text Sources
Other Literature Sources
Miscellaneous
