Representation of interval timing by temporally scalable firing patterns in rat prefrontal cortex
- PMID: 24367075
- PMCID: PMC3890779
- DOI: 10.1073/pnas.1321314111
Representation of interval timing by temporally scalable firing patterns in rat prefrontal cortex
Abstract
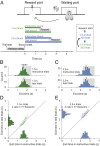
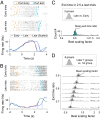
Perception of time interval on the order of seconds is an essential component of cognition, but the underlying neural mechanism remains largely unknown. In rats trained to estimate time intervals, we found that many neurons in the medial prefrontal cortex (PFC) exhibited sustained spiking activity with diverse temporal profiles of firing-rate modulation during the time-estimation period. Interestingly, in tasks involving different intervals, each neuron exhibited firing-rate modulation with the same profile that was temporally scaled by a factor linearly proportional to the instructed intervals. The behavioral variability across trials within each task also correlated with the intertrial variability of the temporal scaling factor. Local cooling of the medial PFC, which affects neural circuit dynamics, significantly delayed behavioral responses. Thus, PFC neuronal activity contributes to time perception, and temporally scalable firing-rate modulation may reflect a general mechanism for neural representation of interval timing.
Conflict of interest statement
The authors declare no conflict of interest.
Figures


Comment in
-
Report of interval timing or action?Proc Natl Acad Sci U S A. 2014 Jun 3;111(22):E2239. doi: 10.1073/pnas.1404555111. Epub 2014 May 12. Proc Natl Acad Sci U S A. 2014. PMID: 24821818 Free PMC article. No abstract available.
-
Reply to Namboodiri and Hussain Shuler: Analysis of scaling of neuronal activities in medial prefrontal cortex during interval timing.Proc Natl Acad Sci U S A. 2014 Jun 3;111(22):E2240. doi: 10.1073/pnas.1405720111. Proc Natl Acad Sci U S A. 2014. PMID: 25054192 Free PMC article. No abstract available.
Similar articles
-
Distributed representations of temporal stimulus associations across regular-firing and fast-spiking neurons in rat medial prefrontal cortex.J Neurophysiol. 2020 Jan 1;123(1):439-450. doi: 10.1152/jn.00565.2019. Epub 2019 Dec 18. J Neurophysiol. 2020. PMID: 31851558 Free PMC article.
-
Firing characteristics of deep layer neurons in prefrontal cortex in rats performing spatial working memory tasks.Cereb Cortex. 1998 Jul-Aug;8(5):437-50. doi: 10.1093/cercor/8.5.437. Cereb Cortex. 1998. PMID: 9722087
-
Rodent Medial Frontal Control of Temporal Processing in the Dorsomedial Striatum.J Neurosci. 2017 Sep 6;37(36):8718-8733. doi: 10.1523/JNEUROSCI.1376-17.2017. Epub 2017 Aug 8. J Neurosci. 2017. PMID: 28821670 Free PMC article.
-
Diverse synchrony of firing reflects diverse cell-assembly coding in the prefrontal cortex.J Physiol Paris. 2013 Dec;107(6):459-70. doi: 10.1016/j.jphysparis.2013.05.004. Epub 2013 Jun 4. J Physiol Paris. 2013. PMID: 23747709 Review.
-
Searching for the holy grail: temporally informative firing patterns in the rat.Adv Exp Med Biol. 2014;829:209-34. doi: 10.1007/978-1-4939-1782-2_12. Adv Exp Med Biol. 2014. PMID: 25358713 Free PMC article. Review.
Cited by
-
Reply to Namboodiri and Hussain Shuler: Analysis of scaling of neuronal activities in medial prefrontal cortex during interval timing.Proc Natl Acad Sci U S A. 2014 Jun 3;111(22):E2240. doi: 10.1073/pnas.1405720111. Proc Natl Acad Sci U S A. 2014. PMID: 25054192 Free PMC article. No abstract available.
-
Acute Inactivation of Primary Auditory Cortex Causes a Sound Localisation Deficit in Ferrets.PLoS One. 2017 Jan 18;12(1):e0170264. doi: 10.1371/journal.pone.0170264. eCollection 2017. PLoS One. 2017. PMID: 28099489 Free PMC article.
-
Visually cued action timing in the primary visual cortex.Neuron. 2015 Apr 8;86(1):319-30. doi: 10.1016/j.neuron.2015.02.043. Epub 2015 Mar 26. Neuron. 2015. PMID: 25819611 Free PMC article.
-
Selective activation of a putative reinforcement signal conditions cued interval timing in primary visual cortex.Curr Biol. 2015 Jun 15;25(12):1551-61. doi: 10.1016/j.cub.2015.04.028. Epub 2015 May 21. Curr Biol. 2015. PMID: 26004763 Free PMC article.
-
Influence of Recent Trial History on Interval Timing.Neurosci Bull. 2023 Apr;39(4):559-575. doi: 10.1007/s12264-022-00954-2. Epub 2022 Oct 8. Neurosci Bull. 2023. PMID: 36209314 Free PMC article.
References
-
- Buhusi CV, Meck WH. What makes us tick? Functional and neural mechanisms of interval timing. Nat Rev Neurosci. 2005;6(10):755–765. - PubMed
-
- Gibbon J, Malapani C, Dale CL, Gallistel C. Toward a neurobiology of temporal cognition: Advances and challenges. Curr Opin Neurobiol. 1997;7(2):170–184. - PubMed
-
- Ivry RB, Spencer RM. The neural representation of time. Curr Opin Neurobiol. 2004;14(2):225–232. - PubMed
-
- Mauk MD, Buonomano DV. The neural basis of temporal processing. Annu Rev Neurosci. 2004;27:307–340. - PubMed
-
- Buonomano DV, Karmarkar UR. How do we tell time? Neuroscientist. 2002;8(1):42–51. - PubMed
Publication types
MeSH terms
LinkOut - more resources
Full Text Sources
Other Literature Sources
Miscellaneous

