. 2014 Jan 7;111(1):E194-202.
doi: 10.1073/pnas.1303317110. Epub 2013 Dec 23.

Distinct kinetics of synaptic structural plasticity, memory formation, and memory decay in massed and spaced learning

Affiliations

Distinct kinetics of synaptic structural plasticity, memory formation, and memory decay in massed and spaced learning

Wajeeha Aziz et al. Proc Natl Acad Sci U S A. .

Abstract

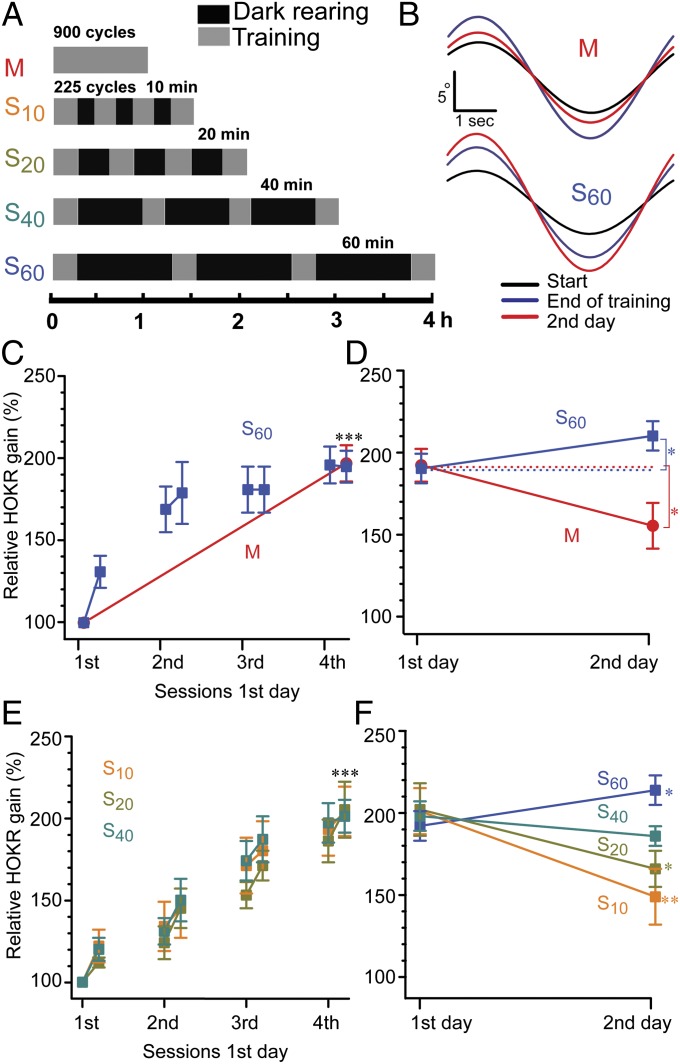
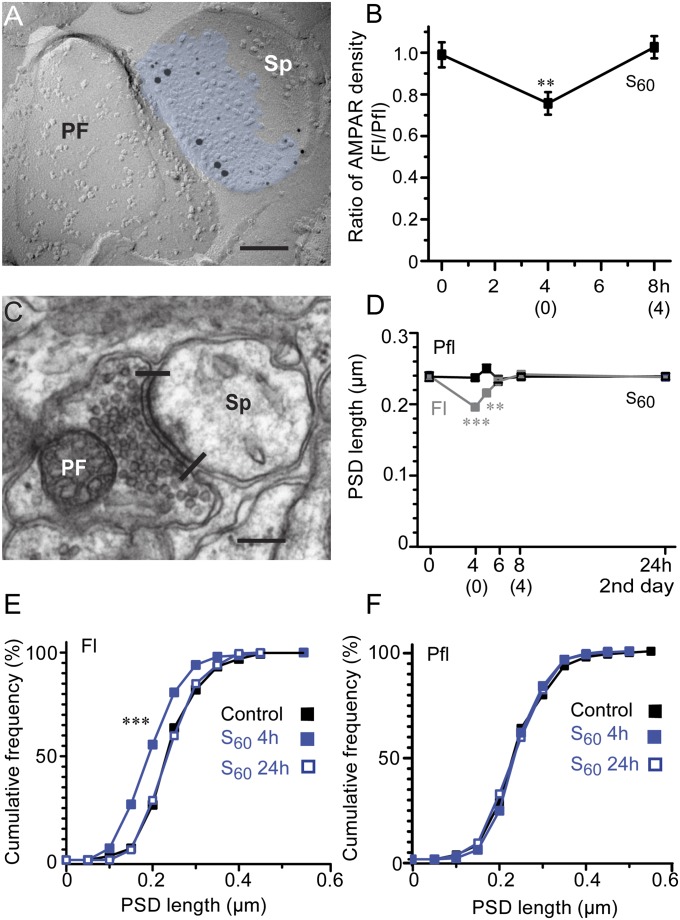
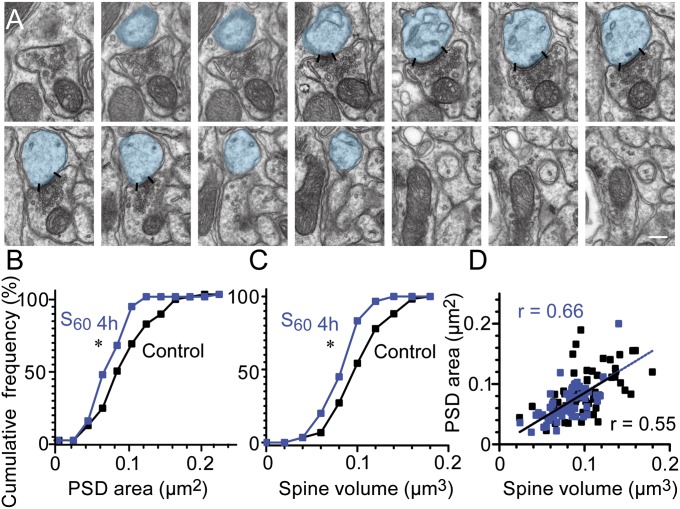
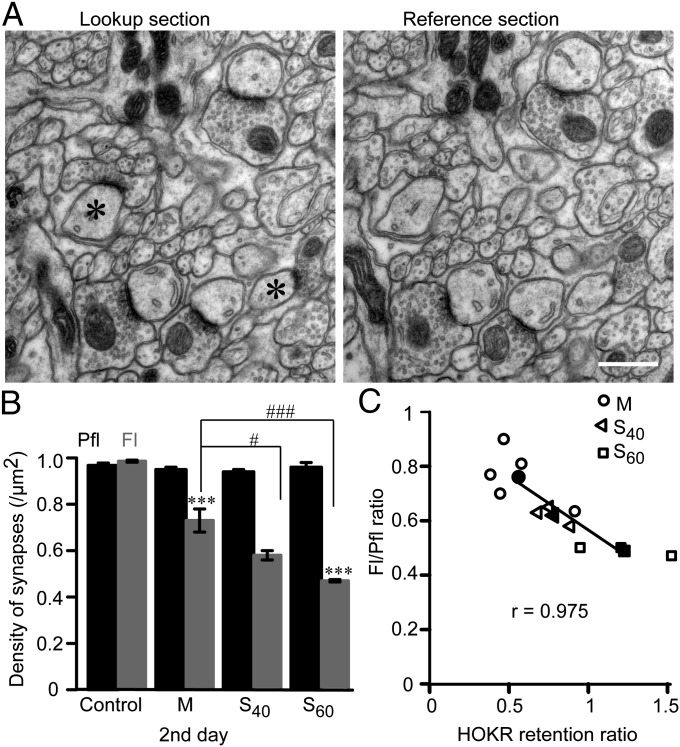
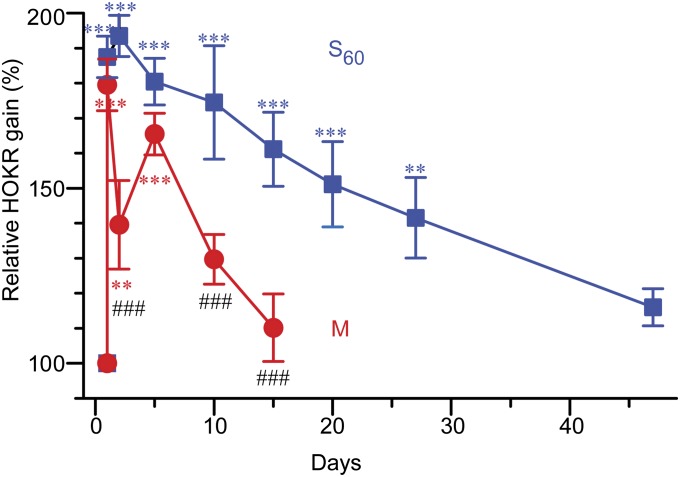
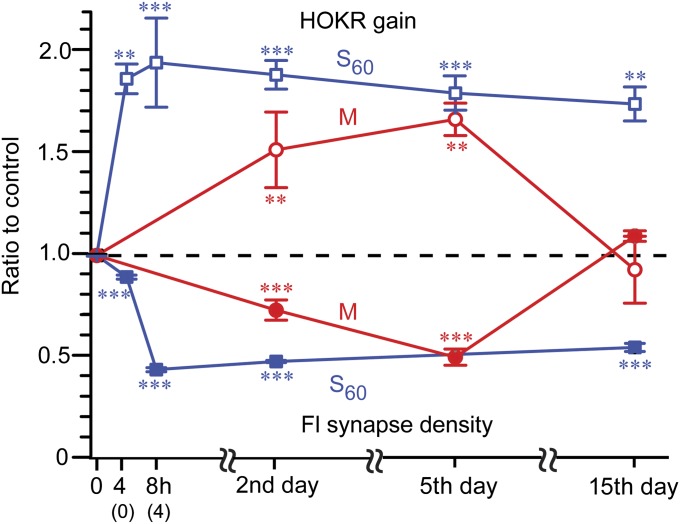
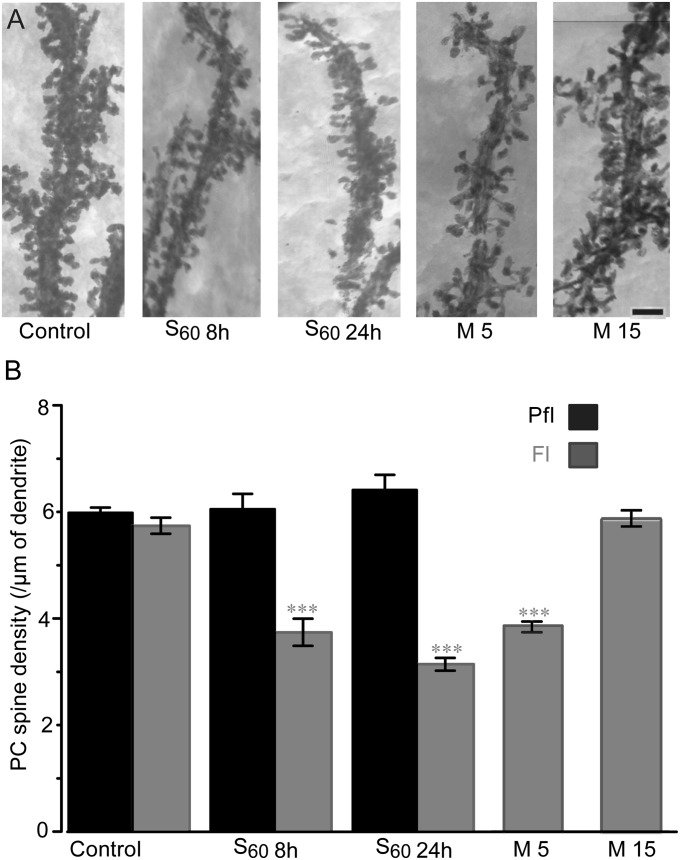
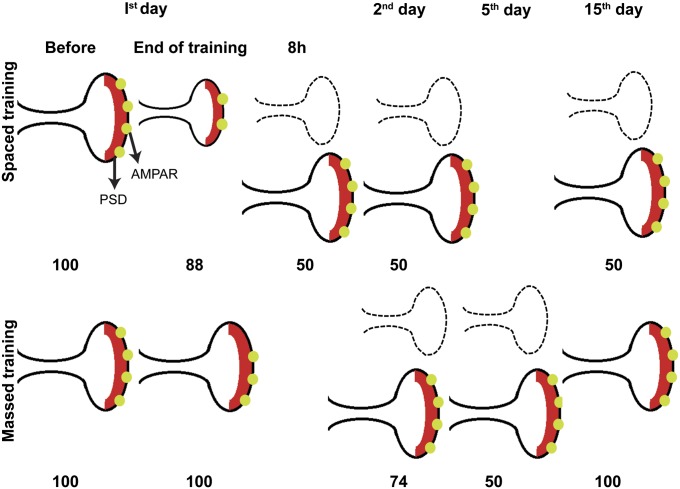
Long-lasting memories are formed when the stimulus is temporally distributed (spacing effect). However, the synaptic mechanisms underlying this robust phenomenon and the precise time course of the synaptic modifications that occur during learning remain unclear. Here we examined the adaptation of horizontal optokinetic response in mice that underwent 1 h of massed and spaced training at varying intervals. Despite similar acquisition by all training protocols, 1 h of spacing produced the highest memory retention at 24 h, which lasted for 1 mo. The distinct kinetics of memory are strongly correlated with the reduction of floccular parallel fiber-Purkinje cell synapses but not with AMPA receptor (AMPAR) number and synapse size. After the spaced training, we observed 25%, 23%, and 12% reduction in AMPAR density, synapse size, and synapse number, respectively. Four hours after the spaced training, half of the synapses and Purkinje cell spines had been eliminated, whereas AMPAR density and synapse size were recovered in remaining synapses. Surprisingly, massed training also produced long-term memory and halving of synapses; however, this occurred slowly over days, and the memory lasted for only 1 wk. This distinct kinetics of structural plasticity may serve as a basis for unique temporal profiles in the formation and decay of memory with or without intervals.

Keywords: AMPA receptor reduction; cerebellar motor learning; synapse shrinkage and elimination.


Conflict of interest statement

The authors declare no conflict of interest.

Figures

Fig. 1.
Fig. 1.
Similar HOKR gain increase at the end of training but distinct retention on day 2 by massed or spaced training. (A) Protocols for HOKR training at 0.25 Hz, 17° screen oscillations. Mice received 900 cycles of 1 h massed (M; red) or 225 cycles × 4 of spaced (S) training with intervals of 10 min (S10; orange), 20 min (S20; dark yellow), 40 min (S40; green), or 60 min (S60; blue). Time taken to complete each protocol is shown in hours below. (B) Representative eye traces from individual animals at the start (black), at the end (blue), and on day 2 (red) after the 1-h training. (C) Similar HOKR gain increase (%) by M (n = 10) and S60 (n = 9). (D) Relative gain increases at the end of training (day 1) and on day 2 indicating retention of HOKR adaptation after 24 h. (E and F) Similar to C and D but for shorter resting intervals of S10, S20, and S40 (n = 6–9). ***P < 0.001 vs. initial gain, one-way ANOVA. (D and F) *P < 0.05, **P < 0.01 vs. end of training on day 1, paired t test.
Fig. 2.
Fig. 2.
Immediate reduction in AMPAR density at PF–PC synapses in Fl and their shrinkage during acquisition of HOKR adaptation by spaced training. (A) An EM image of replica immunolabeled for AMPARs (5-nm particles) in PF–PC spine synapse (Sp) identified by labeling for GluD2 (15-nm particles). The density of AMPAR labeling is calculated by dividing the number of immunogolds for AMPARs/synapse with area of intramembrane particle clusters (blue). (B) Pooled data showing significant reduction of AMPAR density after training (4 h) but not at 4 h after training (8 h) in S60 training. (0) and (4) on x axis represent time after training. Ratios of AMPAR density in Fl compared with those in Pfl are shown (n = 5 each, **P < 0.01, paired t test). (C) PF–PC synapse showing PSD length in single ultrathin sections (edges indicated by lines). (D) Time course of changes in PSD length shows significant shrinkage at the end of training (4 h) and 1 h after S60 training with no change at 4 h after training (8 h) and on day 2 (24 h) in Fl (4 h, ***P < 0.001; 5 h, **P < 0.01; n = 300 for all, MWU test). (E) Significant leftward shift of cumulative distributions of PSD length in Fl detected at S60 4 h (blue filled square; ***P < 0.001, two-sample K–S test) but not at S60 24 h (blue open square) compared with control (black filled square). (F) No change was detected at any time points in Pfl. (Scale bar, 0.2 µm in A and C.)
Fig. 3.
Fig. 3.
Simultaneous shrinkage of synapse and PC spine at the end of spaced training. (A) Serial EM images of a PC spine used to measure PSD area (edges indicated by lines) and PC spine head (blue) volume. Last three serial sections represent the neck of spine and were not used for spine head volume estimation. (Scale bar, 0.2 µm.) (B and C) Cumulative frequency plots showing significantly smaller PSD (leftward shift) (B) and spine size (C) just after the completion of S60 training (S60 4 h, n = 60; blue) compared with control (black; n = 60, *P < 0.05, two-sample K–S test). (D) Scatter plot showing positive correlation of the spine head volume and PSD area in both control and S60 4 h (control, r = 0.55, black line; S60 4 h, r = 0.66, dashed blue line; ***P < 0.001 for both groups, Pearson correlation).
Fig. 4.
Fig. 4.
Strong negative correlation between reduction of PF–PC synapses in Fl and retention of HOKR gain on the second day. (A) Consecutive EM sections (thickness of 70 nm) were used for measurement of PF–PC synapse density using physical dissector method. Synapses present in lookup section but not in the reference section were counted (*). (Scale bar, 0.5 µm.) (B) Significant reduction of PF–PC synapse density in Fl (gray) on day 2 but not in Pfl (black) following M (n = 5), S40 (n = 3), and S60 (n = 3) trainings (***P < 0.001 vs. control Fl, n = 5, one-way ANOVA). The reduction of synapse density by M is still significantly smaller than S40 (#P < 0.05) and S60 (###P < 0.001, one-way ANOVA) showing interval-dependent synapse reduction. (C) Scatter plot showing a strong negative correlation between PF–PC synapse density (Fl/Pfl ratio) and HOKR retention ratio (ratio of HOKR gain increase on day 2 to that at the end of training, r = 0.975, P < 0.001, Pearson correlation). Data from individual animals (open) and the mean (filled) from M (circle), S40 (triangle), and S60 (square) were plotted. Regression line is obtained from means of three groups.
Fig. 5.
Fig. 5.
Distinct kinetics of long-lasting memory in extended time course after massed or spaced training. HOKR gain increase observed on day 2 in S60 (dark blue; n = 12) was maintained over a month and reduced to a level not significantly different from the initial gain on day 47 (***P < 0.001, **P < 0.01, one-way ANOVA). On the other hand, the HOKR gain in M (red; n =15) decreased on day 2 and increased again on day 5 (***P < 0.001, **P < 0.01, one-way ANOVA). The gain increase observed on day 5 in M was similar to that on day 2 in S60 (P > 0.05 vs. day 2 in S60), thus showing delayed formation of long-lasting memory by M. Gains on days 2, 10, and 15 in M showed significant difference from that on day 2 in S60 (###P < 0.001, one-way ANOVA).
Fig. 6.
Fig. 6.
Tightly correlated reduction of PF–PC synapses to the long-lasting memory by massed or spaced training. Time course of Fl synapse density in M (red; filled circles) and S60 (dark blue; filled squares) showed a mirror image of that of HOKR gain (open circles and squares, respectively) expressed as ratios to control. A slight but significant reduction in synapse density was already observed at the end of S60 training (4 h, n = 3), which completely developed within 4 h after S60 (8 h, n = 3) and was maintained at least until day 15 (n = 3, ***P < 0.001 vs. control Fl, one-way ANOVA). Mice trained by M training gradually developed a reduction in synapse density (n = 3, ***P < 0.001 vs. control Fl, one-way ANOVA) reaching a similar level on day 5 to that of 4 h after S60 and recovered to control level on day 15 (n = 3, P > 0.05). **P < 0.01, ***P < 0.001 vs. initial gain in control, one-way ANOVA. (0) and (4) on x axis represent time after training.
Fig. 7.
Fig. 7.
Elimination and recovery of PC spines. (A) High-voltage EM images of PC dendrites in Fl in control, 4 h after S60 (8 h), on day 2 after S60 (24 h), on day 5 (M5), and on day 15 after M (M15). (Scale bar, 2 µm.) (B) Spine densities along PC dendrites showed robust PC spine elimination selectively in Fl (gray) but not in Pfl (black) at 4 h (S60 8 h, n = 5) and 24 h (S60 24 h, n = 5) after S60 training. After M training, a similar spine elimination was observed on day 5 (M5, n = 3) compared with control Fl (n = 5, ***P < 0.001 vs. control Fl), but it recovered on day 15 (M15, n = 3, P = 0.99 vs. control Fl).
Fig. 8.
Fig. 8.
Schematic diagram of the time courses and sequential steps of synaptic plasticity at PF–PC synapses after spaced and massed trainings. Numbers represent the percentages of PF–PC synapses relative to the untrained control. The spines indicated by dotted lines disappeared at the observed time points. Immediate HOKR adaptation after massed training resulted in a reduction in AMPARs (28%) but no structural changes, whereas spaced training produced shrinkage in PSDs (23%) and spine size (20%) with a reduction in AMPAR density (25%) by the end of training. The rapid structural changes observed in spaced training were fully established as a 50% reduction in PC synapses and spines within 4 h after training and were maintained at least for 2 wk. By contrast, massed training slowly produced a 50% synapse reduction by the fifth day that recovered rapidly within 2 wk. Our results strongly suggest distinct structural plasticity in synapses as a subcellular correlate for differential kinetics of memory in massed and spaced learning.

References

    1. McGaugh JL. Memory—A century of consolidation. Science. 2000;287(5451):248–251. - PubMed
    1. Kandel ER. The molecular biology of memory storage: A dialogue between genes and synapses. Science. 2001;294(5544):1030–1038. - PubMed
    1. Moga DE, Shapiro ML, Morrison JH. Bidirectional redistribution of AMPA but not NMDA receptors after perforant path simulation in the adult rat hippocampus in vivo. Hippocampus. 2006;16(11):990–1003. - PubMed
    1. Lee S-JR, Escobedo-Lozoya Y, Szatmari EM, Yasuda R. Activation of CaMKII in single dendritic spines during long-term potentiation. Nature. 2009;458(7236):299–304. - PMC - PubMed
    1. Lee HK, Kirkwood A. AMPA receptor regulation during synaptic plasticity in hippocampus and neocortex. Semin Cell Dev Biol. 2011;22(5):514–520. - PMC - PubMed

Publication types

Substances